Application: Using the NanoDrop One to Quantify Protein and Peptide Preparations at 205nm
by Sean Loughrey, Jessica Mannion and Brian Matlock, Thermo Fisher Scientific
9 Nov 2015
Introduction
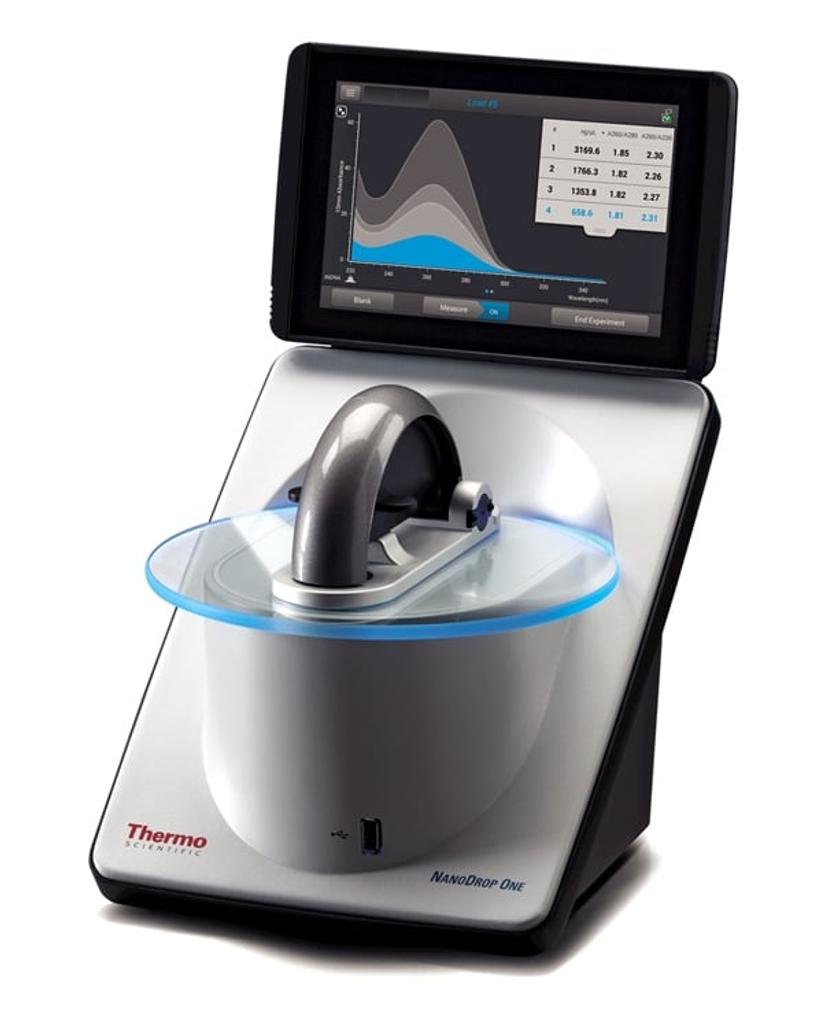
The next generation Thermo Scientific™ NanoDrop™ One microvolume spectrophotometers are pushing the boundaries once to help you understand the quality of your sample before you use it in downstream applications.
Researchers have always needed ways to quickly quantify various biomolecules (e.g. protein and nucleic acid preparations) as a routine part of their workflows. This information helps them make informed decisions before proceeding with downstream experiments. There are many protein quantification methods to choose from including gravimetric approaches, colorimetric assays, direct spectrophotometric UV measurements, and amino acid analysis. All of these methods have their strengths and weaknesses. Direct spectrophotometric UV measurements are a popular choice for researchers because they are simple to perform, require no reagents or standards, and consume very little sample. The Thermo Scientific™ NanoDrop™ One spectrophotometer has preprogramed applications (Figure 1) for direct quantification of proteins using absorbance measurements at 280 nm and 205 nm.
This article specifically describes how to use the Protein A205 application to quantify protein samples. The A205 protein method has a few advantages over the direct A280 protein method. Such advantages include less variability (because A205 extinction coefficients are not based on amino acid composition) and more sensitivity (because of the high molar absorptivity proteins have at 205 nm). A protein’s peptide backbone absorbs light in the deep UV region (190 nm-220 nm). However, past technical limitations made it difficult to take these measurements. Spectrometers’ stray light performance, deep UV linearity, and protein buffers containing UV-absorbing components have all presented challenges. The NanoDrop One patented sample retention technology and low stray light performance have simplified quantification of small amount of protein by A205 methods. This article discusses various A205 methods that can be used to quantify protein samples and present performance data for the various methods on the NanoDrop One instrument.
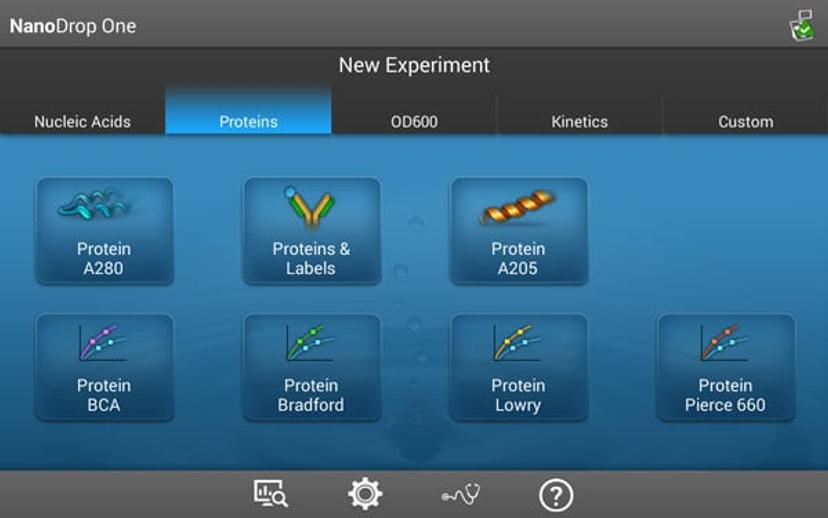
Figure 1. NanoDrop One Proteins Home screen showing available preprogrammed applications.
A205 Extinction Coefficients for Peptide and Protein Measurements
The NanoDrop One Protein A205 application allows customers to choose from three different extinction coefficient options depending on their application:
- ε205=31 method
- Scopes method2
- a custom ε205 1mg/mL method
Previous studies showed that most protein solutions at 1mg/mL have extinction coefficients (ε205 1mg/mL) ranging from 30 to 352. The ε205 of 31 mL mg-1cm-1 is an extinction coefficient often used for peptides lacking tryptophan and tyrosine residues1. The Scopes method gives a more accurate ε205, especially for proteins containing a significant amount of tryptophan (Trp) and tyrosine (Tyr) residues. The increased accuracy of this method takes into account the significant amounts of absorbance at 205 nm contributed by the aromatic side chains. This method uses an A280/A205 ratio in its equation to correct for Trp and Tyr side-chain absorbance3. Recently, Anthis and Clore proposed the use of a sequence-specific ε205 calculation, which is suitable for a wide range of proteins and peptides1. This method is appropriate for pure preparations of proteins or peptides whose amino acid sequences are known.
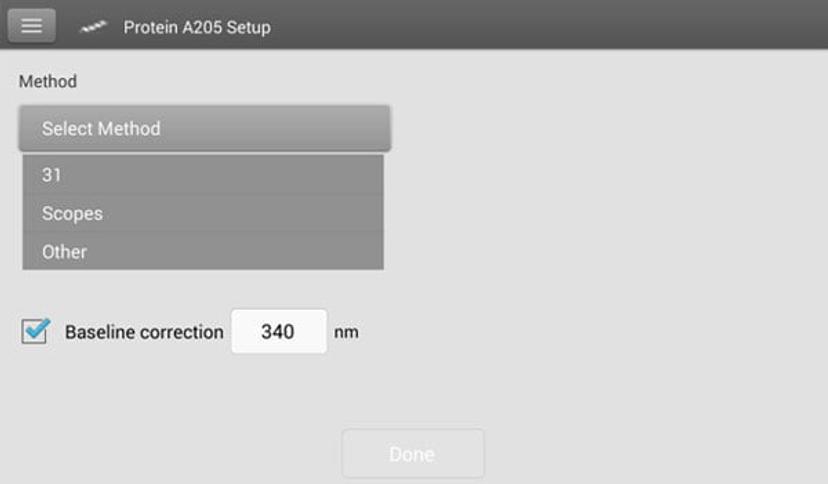
Figure 2. NanoDrop One Protein A205 methods selection screen.
A205 Performance on the NanoDrop One
Preparations of polymyxin, a cationic detergent antibiotic with a peptide backbone, were made in 0.01% Brij 35 buffer and measured on the NanoDrop One and the Thermo Scientific™ Evolution 300 UV-Vis spectrophotometer. To ensure the validity of the measurements taken with the Evolution 300, the polymyxin preparations were diluted in 0.01% Brij buffer. The dilution of samples ensured that the measurements taken were within the linear range of the detector. Measurements were taken in a 10-mm quartz cuvette.
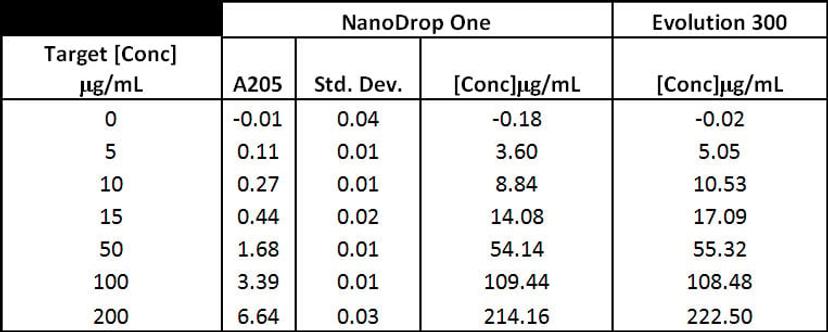
Figure 3: Various preparations of Polymyxin were tested on the NanoDrop One and Evolution 300 spectrophotometers. Five (5) replicates of each solution were measured on the NanoDrop One instrument. Solutions with absorbance over 1.0A were diluted and measured in triplicate on the Evolution 300 using a 10-mm quartz cuvette.
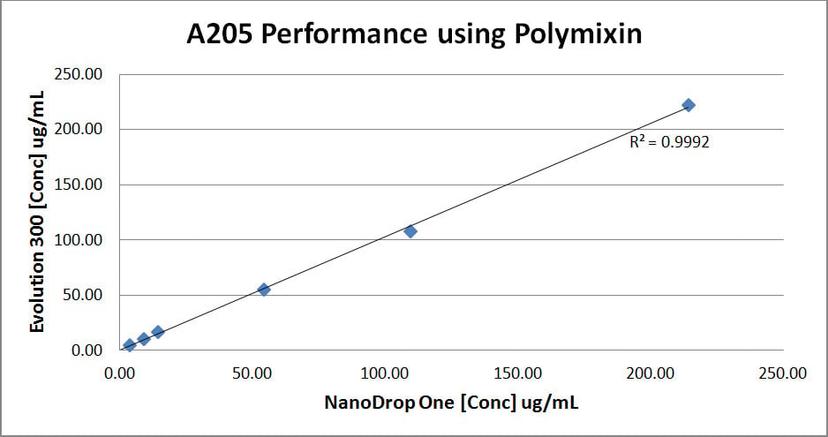
Figure 4: Polymyxin concentrations calculated with the Evolution 300 and NanoDrop One instruments were plotted. Regression line shows a good correlation.
To assess differences between the various extinction coefficients used at 205 nm (i.e., Scopes and ε205=31methods) we made various preparations of bovine serum albumin (BSA) and lysozyme. These preparations were measured on the NanoDrop One instrument using the ε205=31 and Scopes methods.
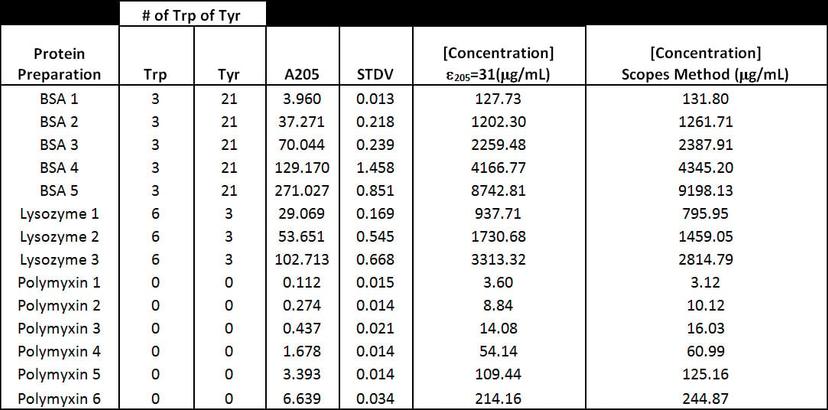
Figure 5: Comparison of different A205 methods for various protein preparations.
Conclusion
To assess NanoDrop One spectrophotometer performance at A205, we compared polymixin concentration values obtained with the NanoDrop One and the Evolution 300 bench-top spectrophotometer, which has excellent stray light performance. Figure 3 shows that the NanoDrop One provided very consistent results between replicate measurements at 205 nm with standard deviations below 0.04A. In addition, the results obtained with both instruments were comparable (Figure 4). Comparison between the different A205 methods shows that the number of tryptophan residues has a large effect on the concentration results (Figure 5). This is because tryptophan is the largest contributor to A280 absorbance, and the Scopes method uses that A280/A205 ratio to correct for aromatic side-chain absorbance at A205. Our results show that A205 quantification using the e205=31 method gives comparable results when proteins have only a few tryptophan residues. One limitation of the A205 method is that many of protein buffers commonly used have absorbance at 205 nm. Before using this technique, we recommend checking the protein buffer for any contribution to the absorbance at 205 nm.
Reference Literature
Anthis, NJ and Clore, GM 2013. Sequence-specific determination of protein and peptide concentrations by absorbance at 205 nm. Protein Science 22:851-858.
Goldfarb, AR, Saidel, LJ, Mosovich E 1951. The ultraviolet absorption spectra of proteins. Journal of Biological Chemistry 193(1):397-404.
Scopes, RK 1974. Measurement of protein by spectrophotometry a 205 nm. Analytical Biochemistry 59:277-282.