Stanford University Immunologists Share Top Tips for Multiplex Assay Success
Learn about best practices for immune monitoring assays using xMAP® Technology from Luminex
26 Sept 2017

Holden Maecker, Ph.D., is a Professor of Microbiology and Immunology and Director of the Human Immune Monitoring Center (HIMC) at Stanford University School of Medicine. Yael Rosenberg-Hasson, Ph.D., is the Immunoassay Manager and Technical Director of the HIMC. Here, SelectScience® interviews the pair to find out how they are using Luminex xMAP® Technology in their laboratory and their top tips for success with xMAP multiplex experiments.
1. How and why do you use xMAP Technology?
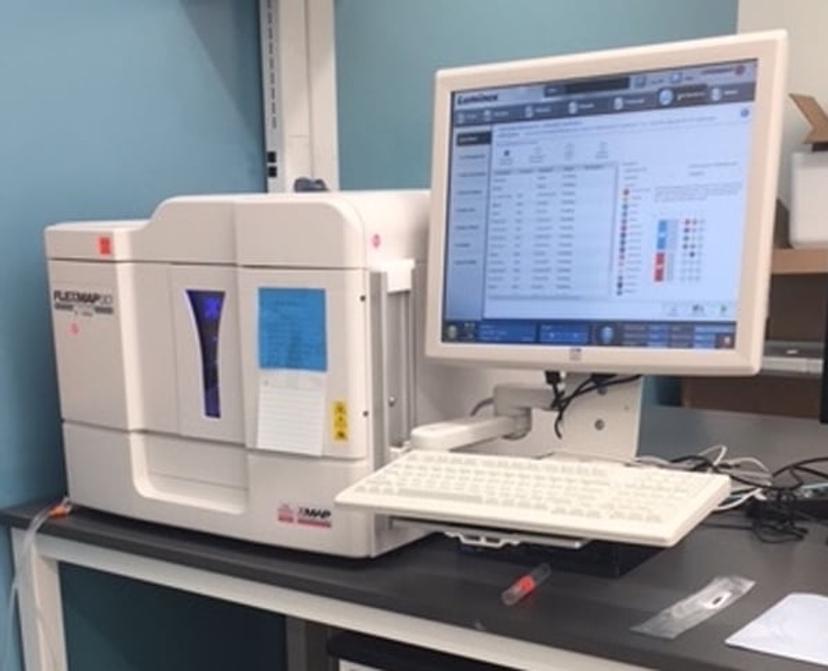
The HIMC is a full-service core laboratory for human immune monitoring assays, offering various immunoassay, cell analysis, and genomics platforms. We use Luminex xMAP assays primarily for multiplexed detection of cytokines, chemokines, and other secreted proteins. We have standard panels for measuring 62 human or 38 mouse cytokines and related proteins. These are used on serum, plasma, cell supernatants, lysates, and other biological fluids. Our studies span a huge variety of diseases and clinical questions, from understanding disease pathogenesis to finding biomarkers of clinical response.
2. What are the most important factors to consider when implementing this technology?
One of the most important elements of any technology is accounting for batch effects. This is a general term referring to technical differences that arise between sample runs (96-well plates in the case of our xMAP assays). The differences tend to increase when plates are run on different days, on different instruments, or especially with different lots of xMAP kits. Many of our recommendations below are designed to mitigate or account for these batch effects.
Other sources of variability include sample preparation, storage, and analysis method. While these may seem straightforward, there are nuances that can significantly affect results. Some advance planning and standardization can help to avoid downstream problems, as we describe below.

3. What are your top tips for scientists planning xMAP-based multiplex experiments?
(a) Plan your sample collection
There are differences in the readout of cytokines between serum and plasma, and even between EDTA-plasma and heparin-plasma (Biancotto et al. 2012; O’Neal et al. 2014; Rosenberg-Hasson et al. 2014). Ideally, the collection matrix should be chosen based on its sensitivity for the desired analytes. Minimally, the same collection matrix should be used throughout a study, for comparability of readouts.

(b) Optimize and standardize sample processing
The sample preparation protocol is equally important. Time-to-blood processing is a variable that should be controlled as tightly as possible (in addition to being as short as possible) (Aziz et al. 2016). In addition, once serum or plasma is harvested from the blood tube, it should be subjected to an additional centrifugation and transfer of the supernatant to a new low binding (polypropylene) tube or plate. This helps avoid cell contamination, which can lead to large increases in non-specific binding in the assay.
(c) Aliquot and store samples properly
xMAP assays require small sample volumes, so aliquots of as little as 200 microliters can be adequate. However, multiple aliquots should be made prior to freezing, to avoid the need for additional freeze-thaw cycles that can compromise certain analytes (Paltiel et al. 2008; de Jager et al. 2009).
Samples need to be stored at least at -80C (not -20C) for long-term stability. A freezer that is frequently opened and warms up is obviously not ideal, and can increase sample degradation.
(d) Design your plates for optimal analysis
Ideally, all samples to be compared should be run on a single plate. Studies of about 40 samples or less can fit entirely on one 96-well plate, with duplicate sample wells and room for standards and control sample(s). For larger studies, multiple plates will be needed. A common set of control wells will then be critical for cross-plate comparisons. In addition, studies with multiple conditions or time points should have all samples from a given subject run together on the same plate. Finally, the plates should be “balanced”, so that groups to be compared are spread more or less equally among them. For example, a study comparing treated and untreated patients should not have mostly treated patient samples on one plate and mostly untreated patient samples on another. Even with shared controls, such a design could introduce artifacts into the comparison between groups.
(e) Run quality checks on your data
One way to introduce quality assessment during the assay is to use AssayChex beads (Radix BioSolutions, Georgetown, TX). These are spiked-in control beads that assess instrument performance, non-specific background, addition of detector antibody, and addition of streptavidin-PE.
It’s also important to check bead counts for each analyte. Acquisition parameters are typically set to yield an average of at least 50 beads for each analyte. Since the distribution of beads across analytes can be unequal, some analytes may in fact have very few beads collected, and the measurements from these analytes are thus less reliable. We suggest that data from analytes with bead counts less than 20 should be discarded, or at least viewed as unreliable.
A third quality check is to examine the coefficient of variation (CV) of replicate wells. In our experience, more than 90% of duplicates within a plate yield CVs of <15%. Replicates with CV >30% should be viewed with suspicion and further examined for all quality checks. If one well of such replicates exhibits low bead counts or AssayChex failure, it may be prudent to discard that well in favor of the other replicate(s).

Finally, it is worth examining the fit of the standard curve, and possibly using different curve-fitting algorithms to optimize the fit. For many cytokines, their normal values in serum and plasma are below the linear range of the standard curve (partly due to matrix effects). This means that estimating concentrations from the standard curve is likely to be inaccurate, introducing noise rather than “standardizing” the values. In these cases, we prefer to use median fluorescence intensity (MFI) values directly, rather than calculating concentrations (see (Breen et al. 2016)). In some cases, MFI ratios between conditions (e.g., before vs. after treatment) may be the most appropriate way to express the data. In cases where adjustment for batch effects is needed, normalization to a shared control or global normalization (e.g., z-score of log-transformed MFI) may be appropriate. Adjustment for non-specific binding based on AssayChex values can also be useful (see (Pomares et al. 2016; Montoya et al. 2017)).
4. What are the key benefits of using xMAP Technology?
The variety of assays available, including many customizable arrays, means that this technology can be applied to many different types of research questions. The protocols are relatively simple, and sample throughput is relatively high, compared to single-plex immunoassays or other immunological techniques. With our standard xMAP cytokine assays, we are able to gain economy by stocking a large batch of kits that are used for many different projects. We also gain efficiency by combining multiple small projects on a single plate, so that we mostly run full or nearly-full plates. All in all, we see the xMAP platform as a key component of our human immune monitoring center for some time to come.
Do you have any other tips for using xMAP Technology? Write a Review here

