Transforming Spectroscopic Research: An Instrumental Story
Discover how a simple change of lab equipment enabled one Ph.D. student to deliver robust results that could help the energy industry
19 Apr 2018
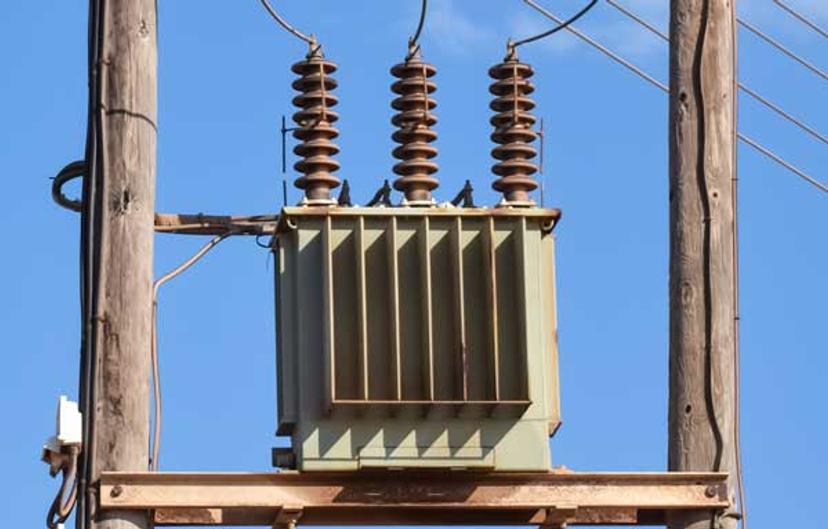
The power lines that interweave our countryside carry electricity from power plants to our homes at enormously high voltages, sometimes as high as 750,000 volts. Clearly, voltages are not at this level when they reach our homes, otherwise our laptops and washing machines would explode or melt. Voltages this high, combined with the high current, are extremely dangerous and are therefore reduced via electrical transformers to levels more manageable for your domestic goods, typically 110-250 volts.
Electric transformers require a large amount of insulation inside them to keep these valuable devices safe. Typically, this insulation involves Kraft paper (that’s right, brown paper bags!) and mineral oil, owing to their dielectric properties. However, due to the energy intensive nature of transformers, over time these dielectric materials can degrade, needing replacement, which can cost thousands of pounds each time.
SelectScience® speaks to Graeme Smith, a Ph.D. student at Glasgow Caledonian University, UK, about the technology enabling robust analysis of these dielectric materials and how his application of a statistical analysis to spectroscopic studies might save the energy industry significant sums of money.
A quick and easy maintenance test
“What I am trying to do is a quick, chemometric analysis into how the insulators are performing inside the equipment, to enhance predictive maintenance of this equipment,” Smith tells us.
Currently, energy companies do not employ predictive maintenance on the electrical transformers, the mineral oil is replaced and then sent for dissolved gas analysis. “The mineral oil could come back absolutely fine, but it doesn’t matter — they’ve already changed it,” says Smith.
“To take out 100 L of oil and replace it, can be anything upwards from £1,000... But if you don’t need to do that, and you can do a test on a small sample of the oil to say it’s fine, this can save energy companies a lot of money.”
Smith is using FTIR to analyse changes in the oil spectra and employing a principal component analysis to detect the chemical breakdown markers in the oil — a faster and more straightforward approach than conducting post gas analysis. However, in order to conduct the principal component analysis, robust and repeatable measurements are needed. Here, Smith struggled to maintain a constant baseline with traditional FTIR instruments.
Solving a problem with drift
“The main problem I had was with the traditional sodium chloride cell. I was having an issue with sample thickness. As the sample degrades it becomes thicker, more viscous and harder to sample. The more I put it in the traditional cell, even with the same sample, I was getting a huge background drift.”
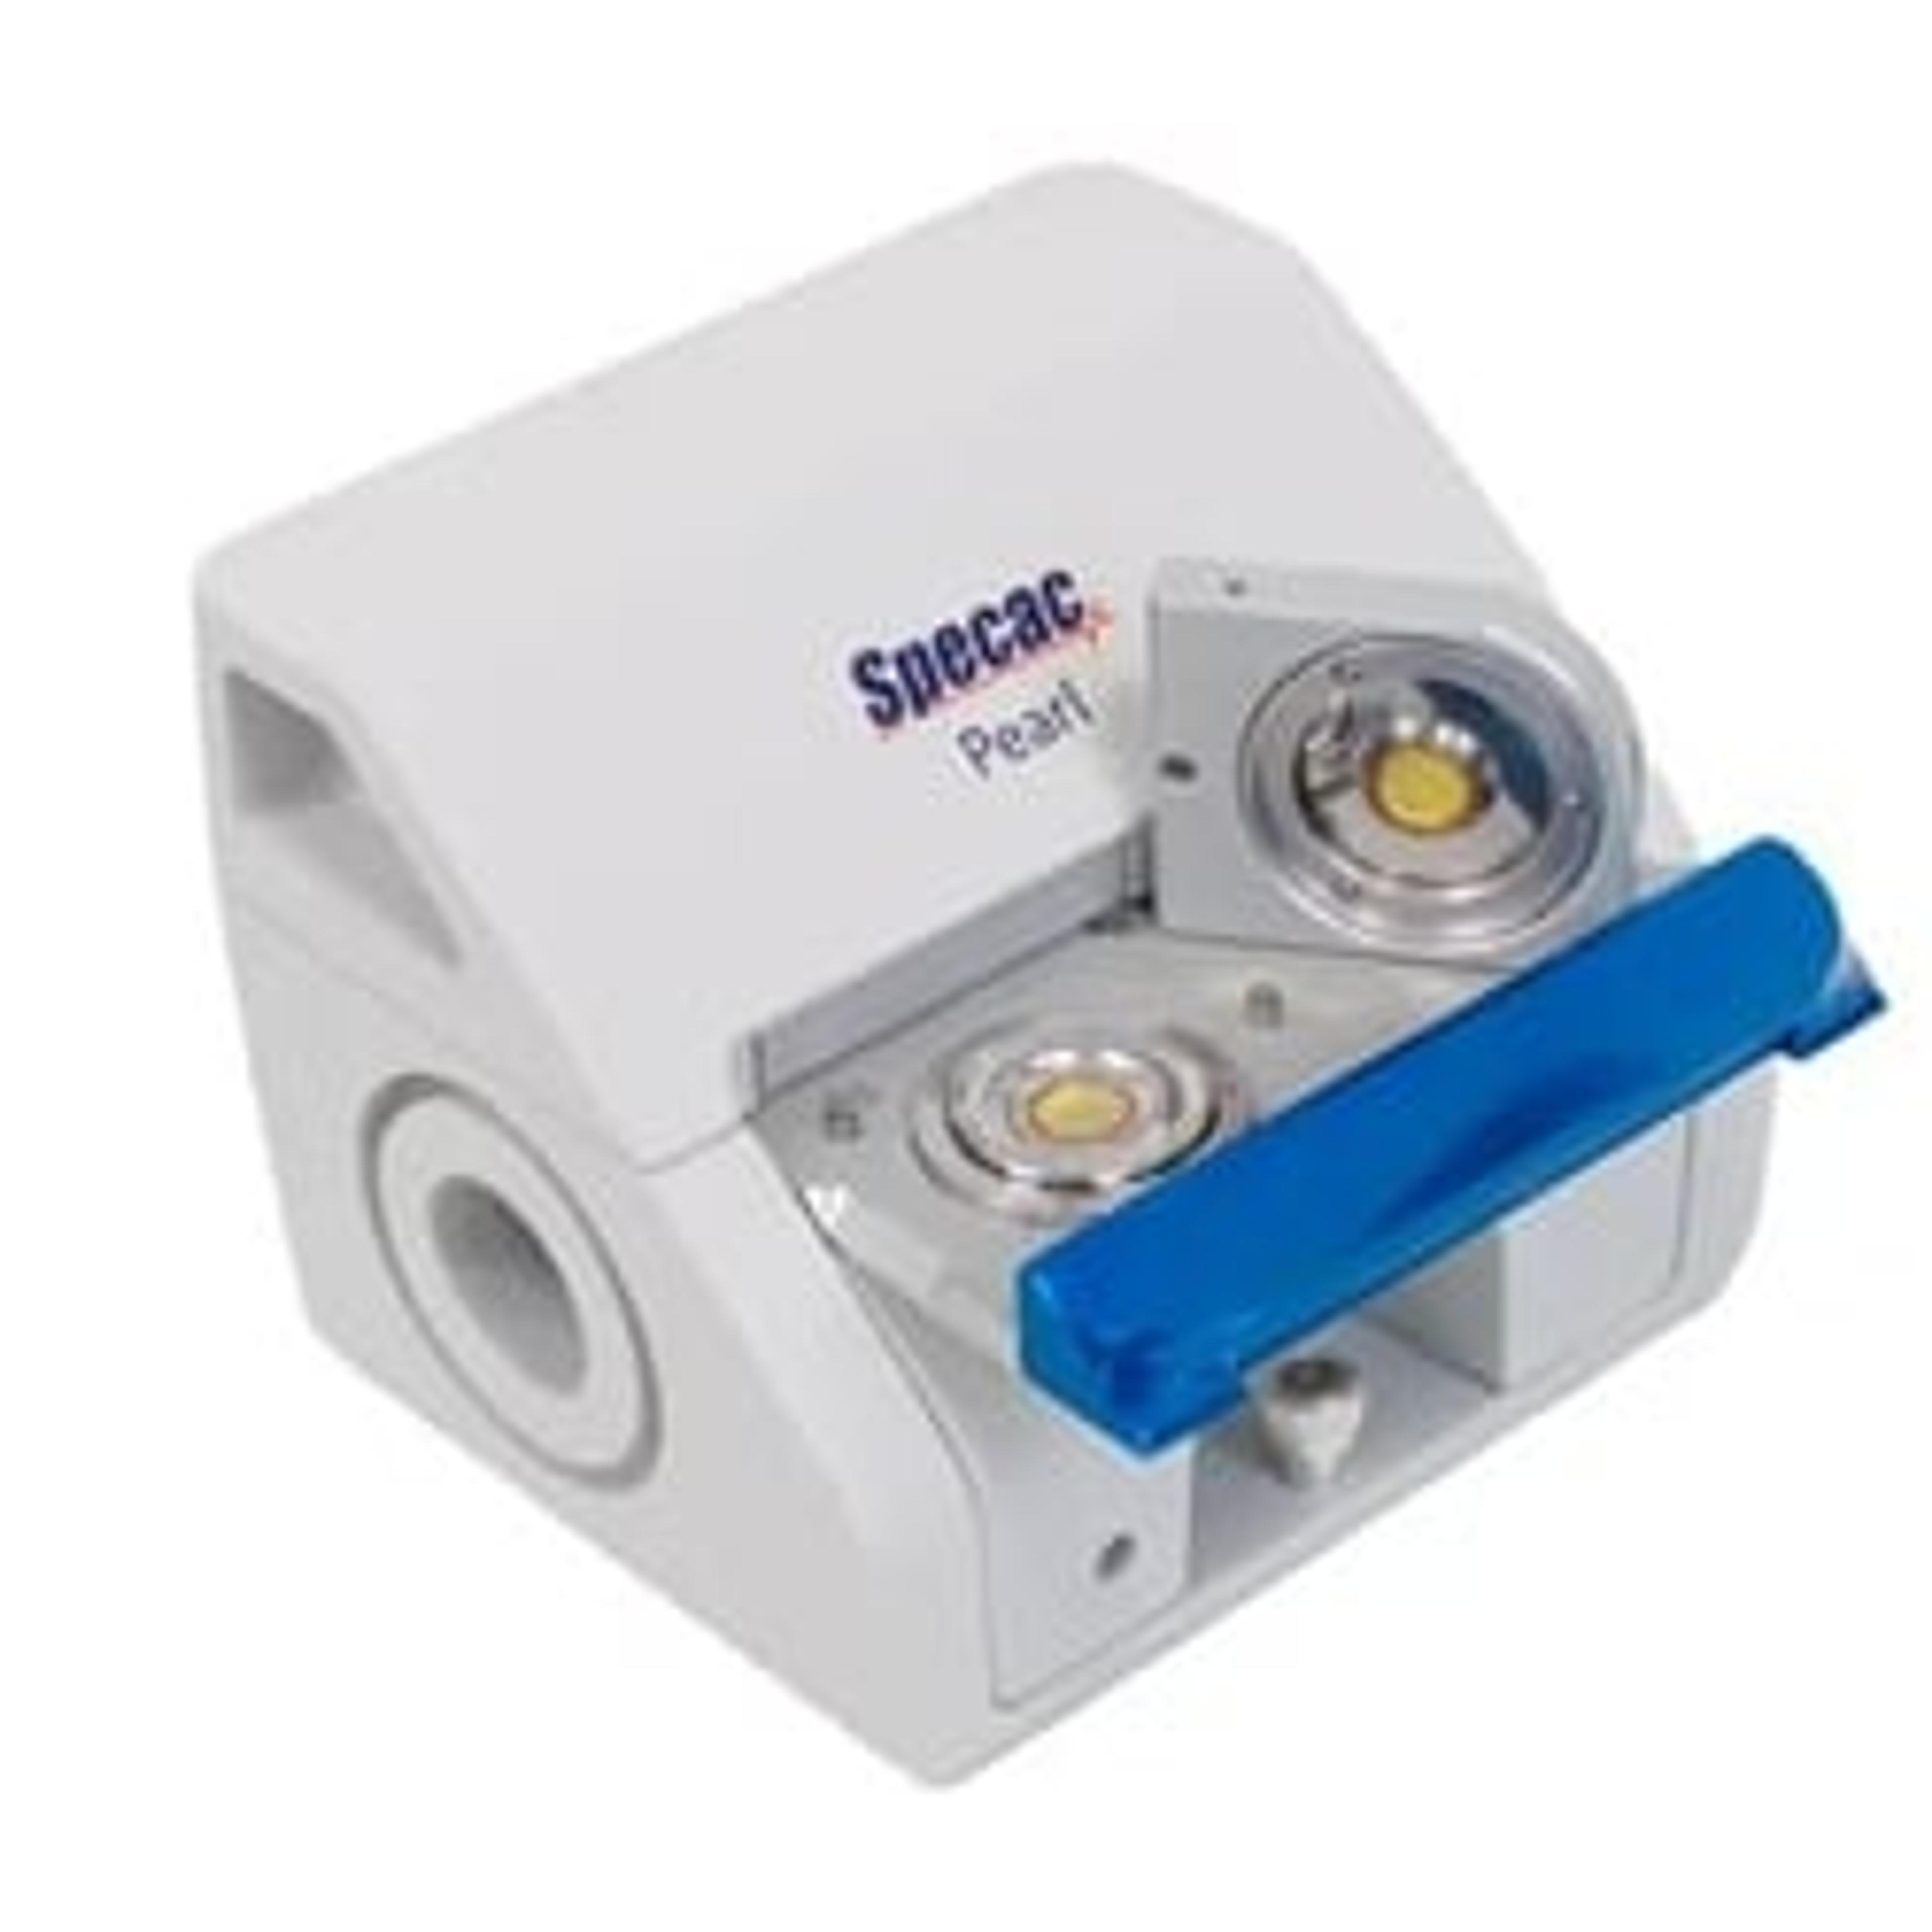
Smith and his supervisor found that by switching to the Specac Pearl Liquid Transmission Accessory, the problem was eliminated.
“When you put the sample on the cell and close the Pearl, any excess is pushed out over the side, creating a uniform film thickness, removing any drift that I was seeing,” explains Smith, which enables him to effectively observe the growth of carbonyl peaks in the mineral oil under thermal stress.
“It’s a lot simpler, particularly when you’re running eight conditions, with 10 data points, two reps each. It takes a long time when you’re doing that traditionally.”
“The repeatability has sped up the results because I am now able to confidently get those results.”
A straightforward statistical method
With this, Smith was able to employ a principal component analysis of the results, to compare the variances and similarities between the IR Spectra of the various combinations of the mineral oil with the innards of an electrical transformer (Kraft paper and copper) at ambient and elevated temperatures. Each one exhibits a differing response in the principal component analysis, which you would not be able to determine spectrally. This demonstrated, for the first time, a statistical method of assessing the degradation of mineral oil. Smith hopes to correlate his results with tests commonly used by service engineers, such as interfacial tension and neutralisation number, as a predictor model.
“This will then translate it into a number an engineer can understand. So, they can say ‘right I’ve taken the spectra, it’s given me a number of 0.4, that means it’s good, the oil doesn’t need replacing – or 1.0, that means it bad, let’s replace the oil’.”
Which piece of lab equipment has made the most difference to your research? Write a review about the equipment you use today for the chance to win a $400 Amazon voucher.