Unlock the Secrets of Big Data with Next-Generation Bioinformatics Software
Instant analysis of omics data using fast and versatile data visualization software
4 Dec 2018
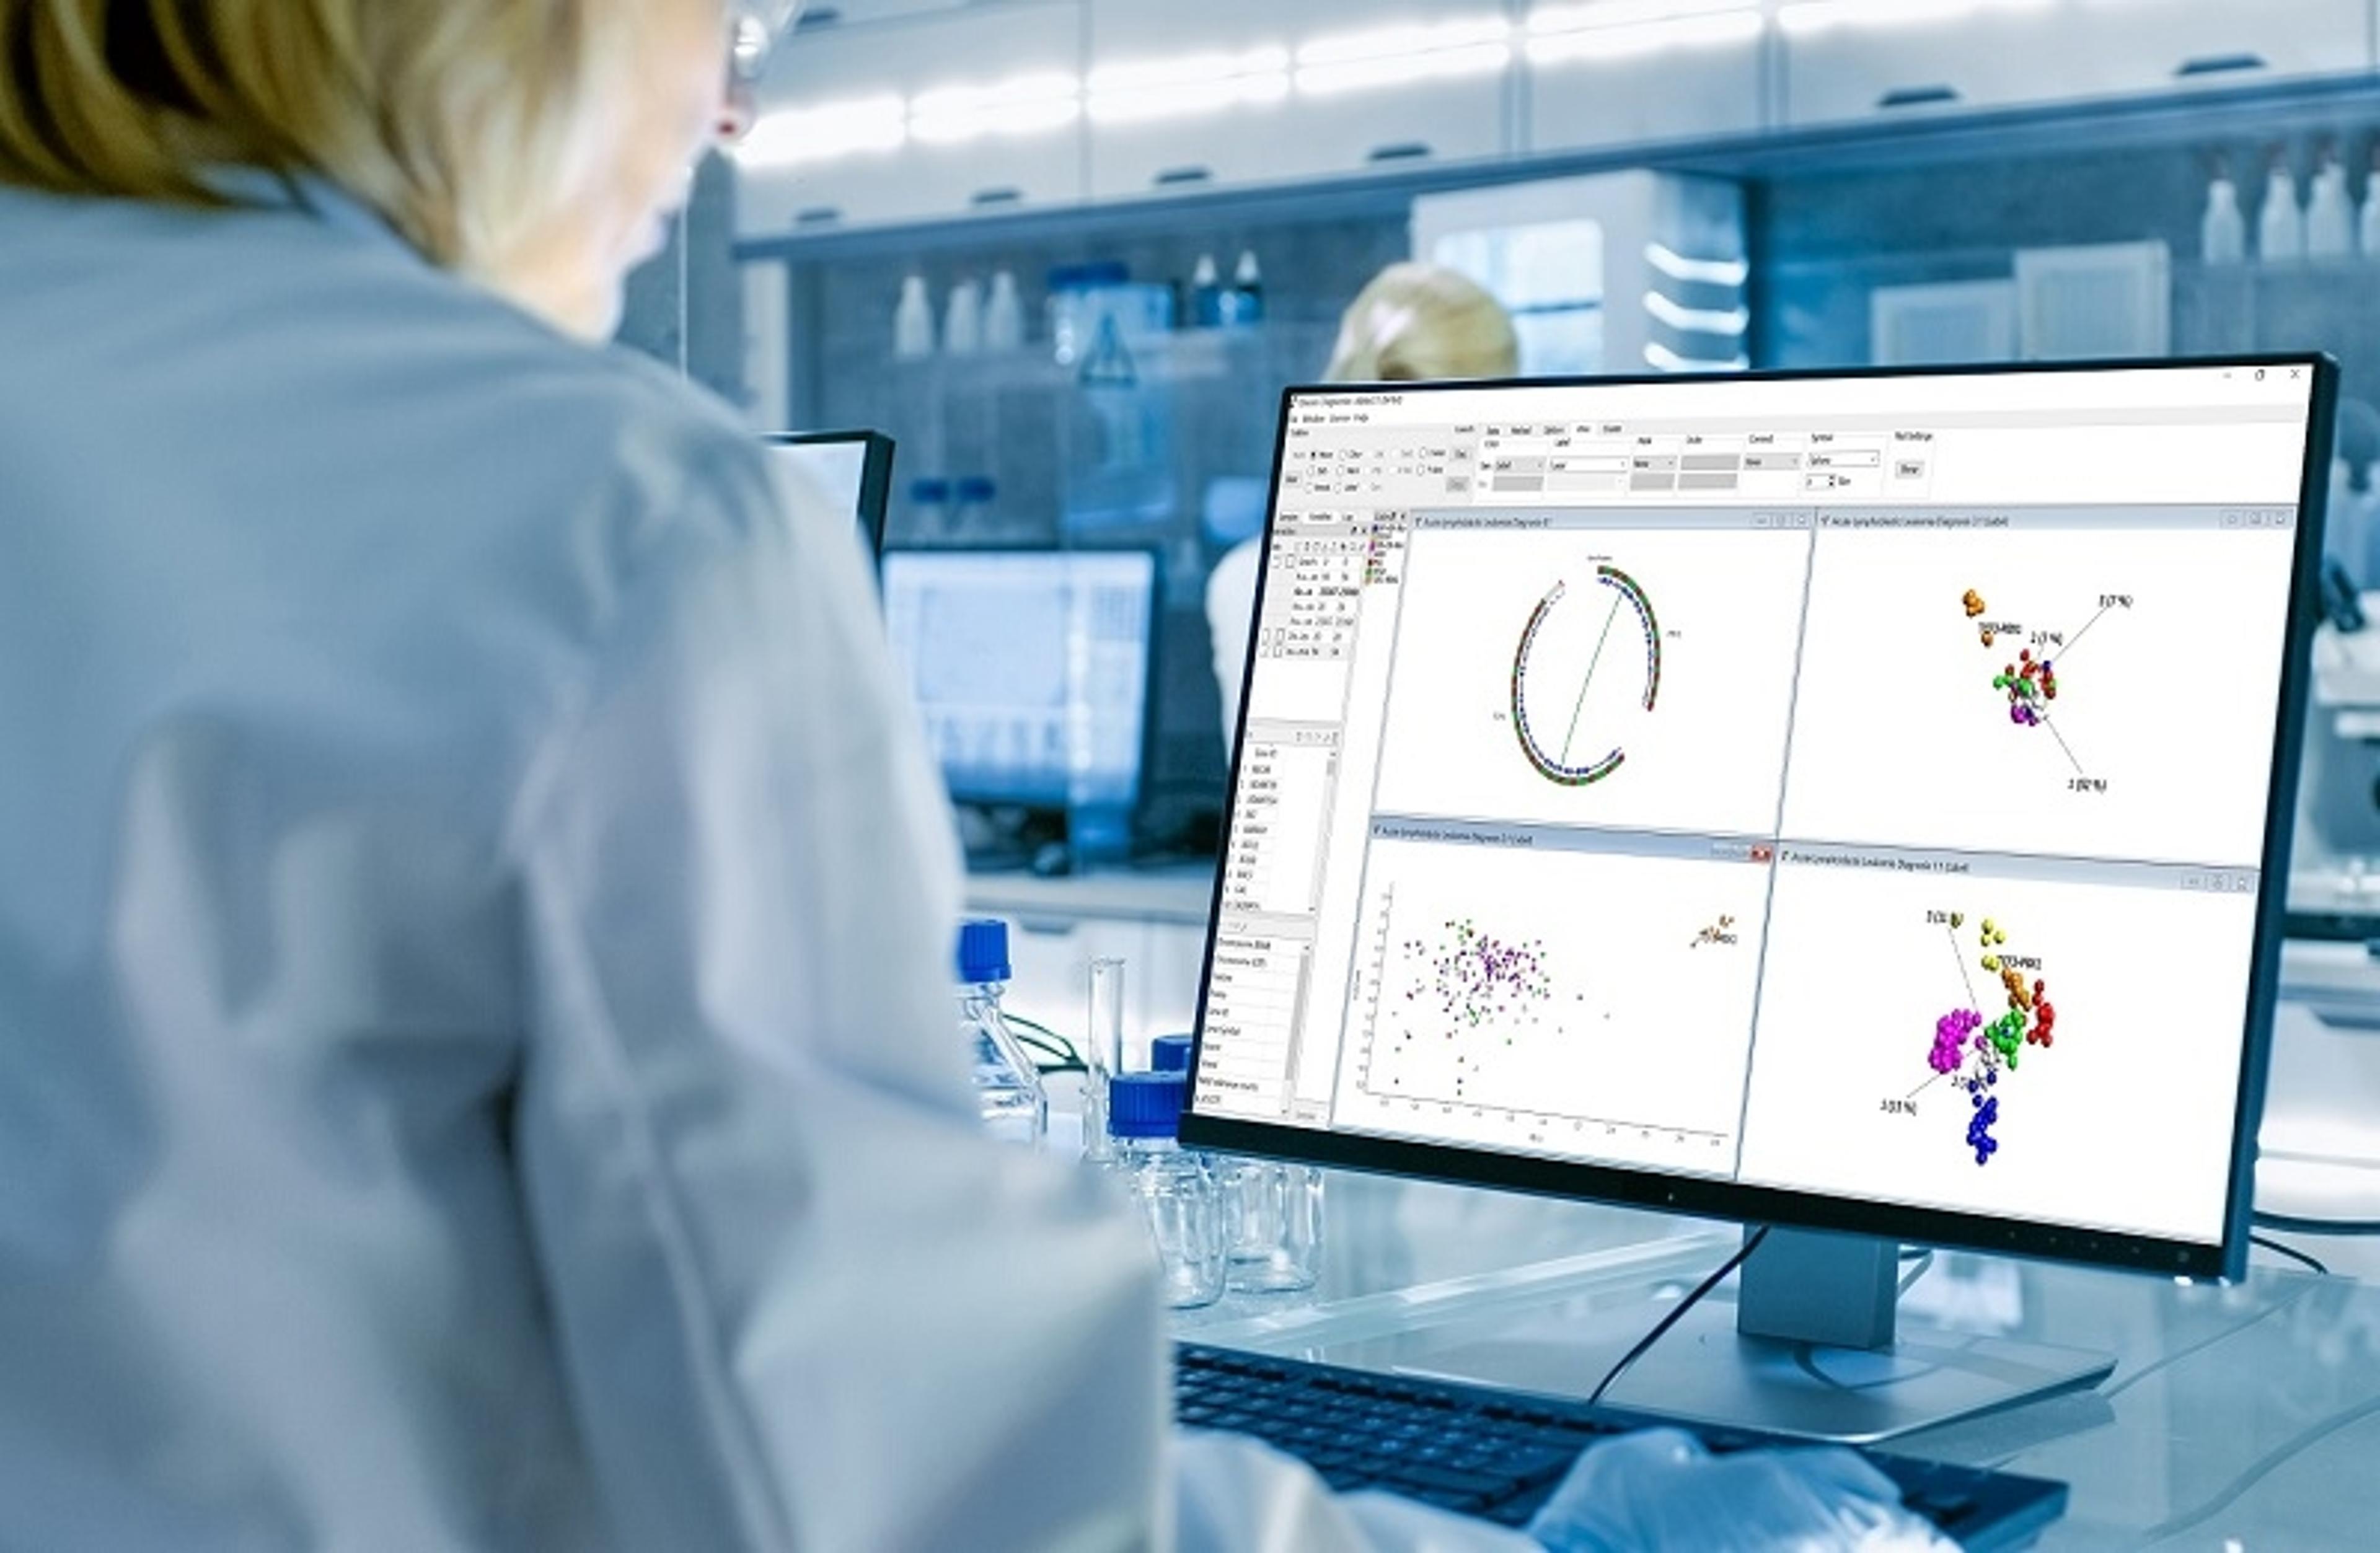
Visualization-driven data analysis tools can help to identify hidden patterns and structures within big data, accelerating the discovery process. In this webinar, Qlucore President, Carl-Johan Ivarsson, demonstrates one such tool, the Qlucore Omics Explorer, and highlights the benefits of using this program for visualization-driven data analysis:
- Instant analysis of omics data using fast and versatile visualization software
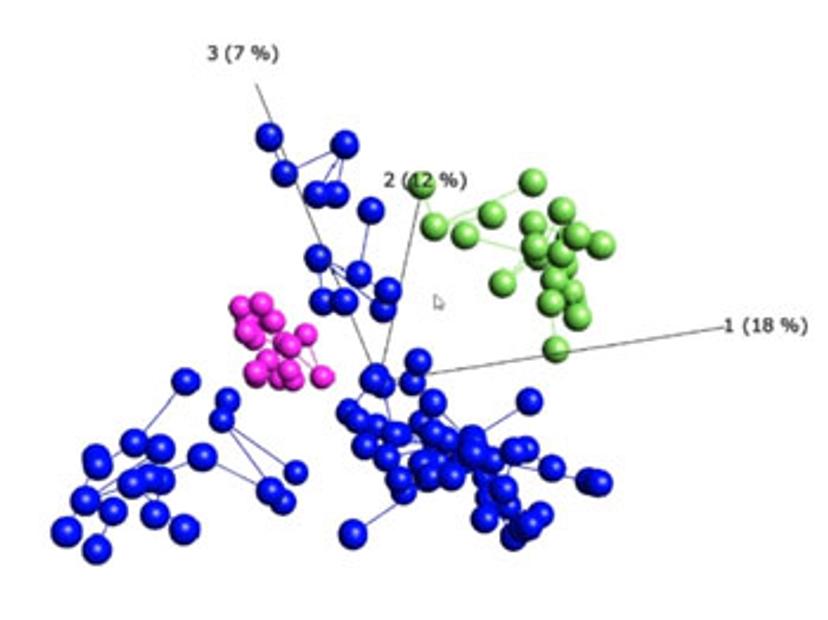
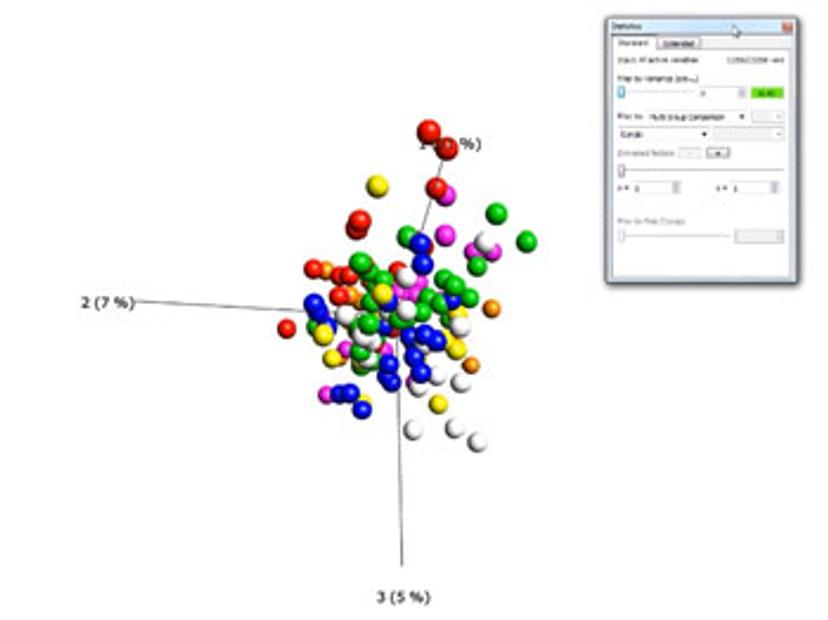
- Explore hidden patterns through visualization of big data
- Select your own workflows and starting points
- Flexible sharing of results
Flexible software
Is it possible to integrate the program into a workflow?
Yes. The solution is what we call 'templates', available in version 3.5 (December 2018). They are shipped with the program, giving you a number of pre-configured templates to assist you in completing standard operations. This enables you to operate the program with fewer mouse clicks than shown in the demonstrations. It is also possible for an organization to write their own templates, meaning that they can get the exact workflow configuration in the program as they like. For the import and output, we take a very generic approach using standard file formats, as much as possible, so you can get data in and you can get data out easily from the program. So, yes, it is easy to integrate it into workflow.
What makes the NGS module in Qlucore different from the conventional module?
That's a good question, and I don't show the NGS module in this presentation, but the NGS module is built up by several components that include a generic genome browser. But what is unique is that it's coupled with dynamic filters on genomic entities, in the same way as you see me use the filters in the webinar demonstration during variance sliding. In the same way, as I interact with the program on expression data, you can interact with it using NGS data. That really is a unique flexibility and functionality that you should try out if you have NGS data.
How much is the software?
We license the software for a yearly or annual fee and then include upgrades and updates. So, you're always getting the latest version and latest functionality. For pricing, I recommend you reach out to us at Qlucore, because the pricing varies depending on whether you're in academia or industry, and how many users you want for example. Reach out and someone will be happy to give you a good price.
Technical queries
What operating systems is the program available on?
It's available on Windows and on Mac.
Do you have to use a specific input file format for RNA sequencing data?
There are several options depending on how much of the functionality you would like to use in the program. If you would like to use all the built-in normalization, you would start with an aligned BAM file. If you have already normalized your data, you can also import it as a text file.
Are there any data size limitations with the software, and is it possible to analyze a whole transcriptome in a single go?
It's a good question and a little bit tricky to answer. Firstly, you can absolutely analyze a whole transcriptome in a single go. Qlucore have been running the program with hundreds of transcriptomes in parallel. On the other hand, since the program is running locally on your machine, of course there are limitations in how much memory you have, how much hard disk space and so on. These are factors that are easy to sort out and we can discuss those type of questions in detail if you reach out to us. As a quick guide, on a regular laptop or desktop computer you will be able to work with at least 500 samples and 100 000 variables.
Try for yourself
How easy is it to get started?
It is really easy. We have a nice suite of supporting information, both written and, of course, video-based. You can get started straight away and do the type of analysis that I demonstrate during the webinar. You can find discriminating variables, do gene set enrichment analysis and visualization, and explore in many ways.
Can I try for myself?
Yes. You can absolutely do that. Just go to our website and download a free trial. It works for 10 days. It has full functionality except with some limitations of exporting results. So just go there, register, and download, and we will be happy to support you during the trial.
Want to find out more? Catch the webinar on demand today: