Webinar Highlights: Introduction to FT-IR Spectroscopy
In this webinar, Spectroscopist Dr Fawzi Abou-Chahine gives an informative introduction to the fundamentals of modern FT-IR spectroscopy
4 Nov 2016

Learn about the theory and applications of FT-IR spectroscopy

Dr Fawzi Abou-Chahine
Spectroscopist at Specac, involved in product development and testing. Dr Abou-Chahine is a physical chemist with experience in the preparation and spectroscopic analysis of inorganic nanoparticles and molecular thin films.
Dr Fawzi Abou-Chahine is a Spectroscopist at Specac, where he is involved in product testing. In the webinar, the theory behind FT-IR (Fourier transform infrared spectroscopy) is explained and examples of its application in a variety of industries is discussed. The webinar also covers some of the new technological developments which are helping to improve the technique.
Read on for highlights from the Q&A session of the webinar, and if you missed it, watch the webinar on-demand.
Q: How is it possible to use FT-IR to determine higher order structures for proteins, peptides, antibodies and related materials?
A: The proteins and peptides will have carbonyls or amides within them and these functional groups vibrate at particular frequencies. Therefore, you can detect them if they are present in your sample. You won’t be able to detect antibodies per se, but you could in principle see signatures from molecular vibrations within a protein.
Q: Is it possible to see nanoparticle vibration?
A: You can detect nanoparticles; however, it depends on the type of nanoparticle and the concentration. A lot of UV/Vis work is done with nanoparticles because the band gaps are large enough that they absorb in the UV/Vis region.
In functionalized nanoparticles, you’re detecting the functional group so it depends on whether the functional groups vibrations are present in the infrared range. For example, if you’re dealing with carbon nanotubes you can have additional carboxylic acid groups attached to them and put derivatives on the nanotube to observe those absorption peaks. This would allow you to quantify them.
If you coat your nanoparticles with a protective shell, another method you can use is using the vibration of those linker molecules to measure the concentration of nanoparticles. A good paper to read is this topic is: doi:10.1155/2010/603978
Q: How do you select a suitable peak for a calibration curve? For example, is it be better to use a well resolved peak on the shoulder of a larger one?
A: You want to pick peaks that are well resolved at a broad range of concentrations so you get a lot of statistically meaningful data points. You want a peak that you can observe both at high and low concentration to see the absorption change with concentration. A small shoulder can be good if it’s not completely masked by a more dominant peak at higher concentration.
Q: What is the main difference in using the ATR and the Pearl accessory?
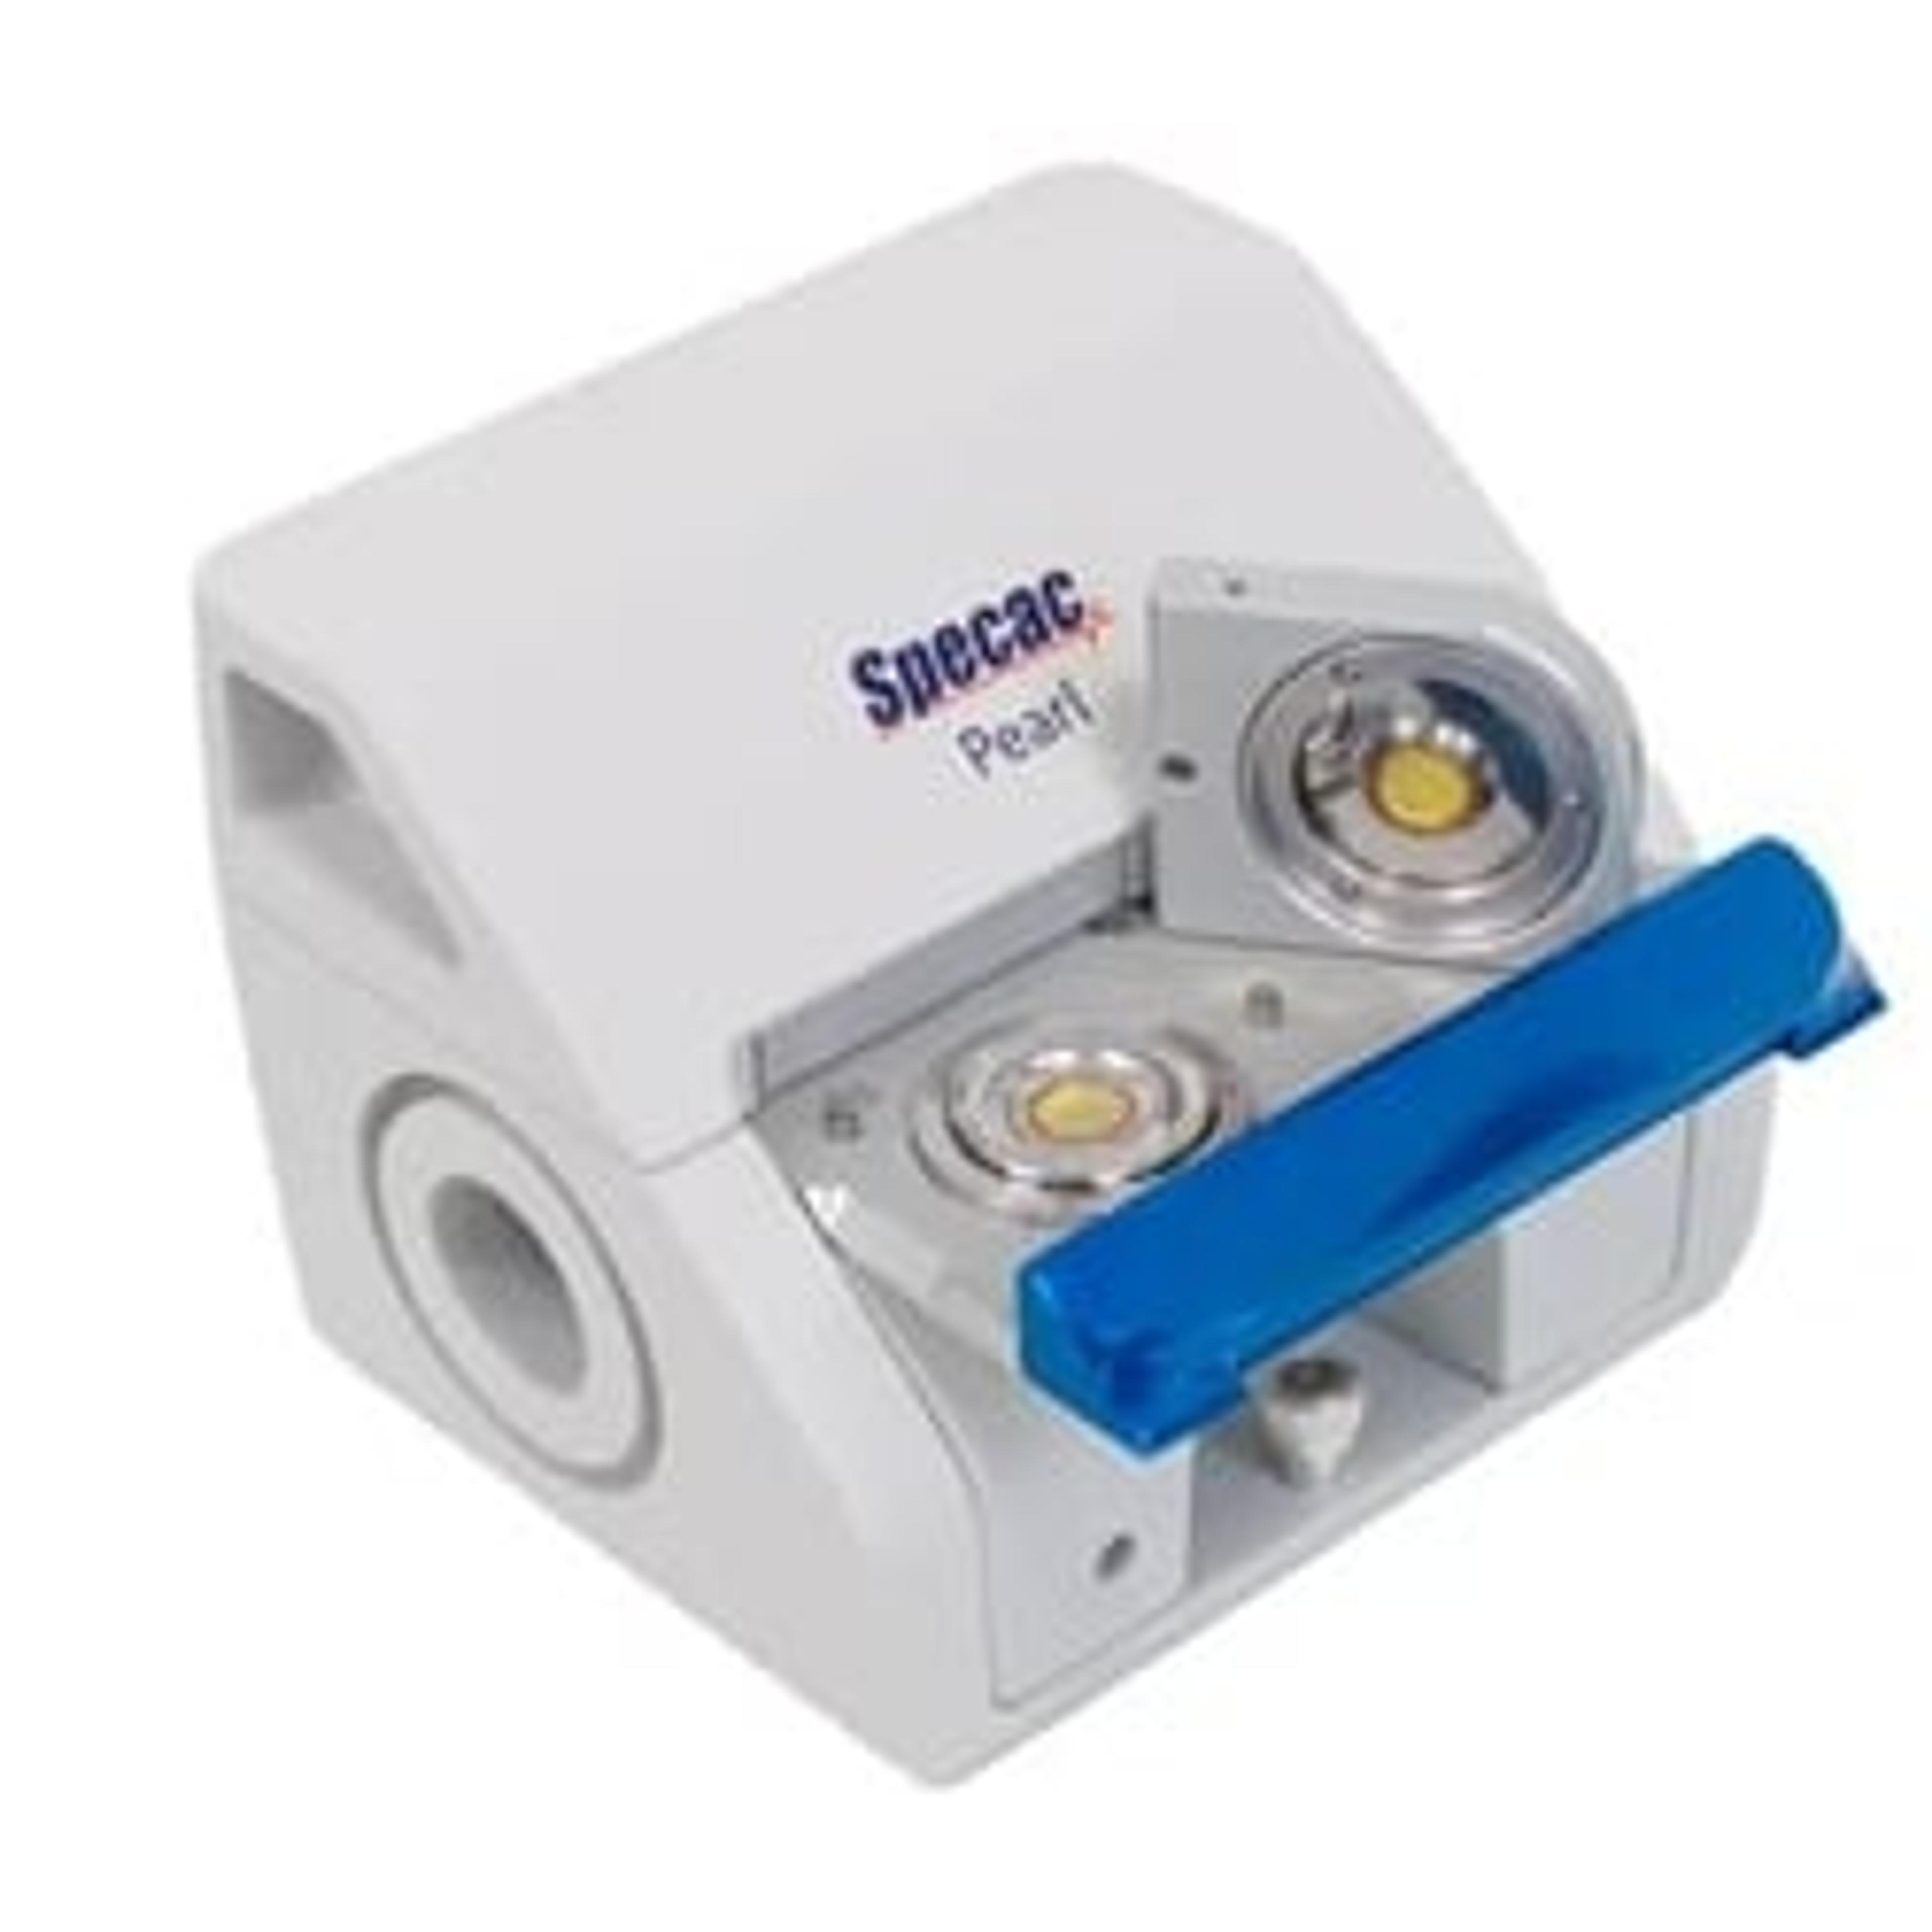
A: The ATR is a very useful and reliable accessory for looking at powder and solids. The Pearl is mainly used for liquids. The ATR also lets you look at absorbance spectra where your concentration is very high and you need to use a low path length in the order of 4-5 micrometers. The Pearl has more flexibility; you can go from 25 micrometers all the way up to a millimeter. Therefore, the main difference is in the path length you can achieve.
Q: What is the best way to analysis viscous and volatile adhesive?
A: With viscous materials ATR is quite good, but can be hard to clean and you must be careful with your solvents. The Pearl is also quite useful for this. You can use the ATR with volatile samples. However, you need a good seal around the solvent so that it doesn’t evaporate into the environment and ruin the detector or cause a signal which is false.
Q: Does path length always mean the thickness of the sample?
A: Yes, it does in relation to transmission spectroscopy. When you are using the Pearl or liquid cells, the path length is the gap between the front and rear window because the solution will fill that volume. When you’re looking at surface measurements, such as with the ATR, the path length will be depth which the light that will penetrates into the sample.
Q: When would you use a long path length and when would you prefer a short path length?
A: A long path length would be used if the concentration you want to analyze is quite low and one you can’t increase it easily. For instance, when analyzing ozone in the atmosphere it’s not easy to increase the concentration of the sample, so you’d use a long path length gas cell. If you have a very intense concentration it is likely to absorb too strongly and saturate the detector, you’d need to use a shorter path length. In the order of 2 or 3 micrometers would probably be suitable.
Q: How would you choose the material of the windows?
A: You want to eliminate the absorbance from the background environment, which includes the air but also the window. Therefore, you need to include a window which is transparent. If you wanted to look at vibrations in the infrared range, you would choose a material such as zinc selenide as that is quite transparent to infrared wavelengths. Similarly, if you want to look at electronic transitions at the Vis/UV wavelengths, you’d chose a different material such as calcium fluoride. You need to know what region of the spectrum you are looking at to choose a material for the window.
Q: What solvent would you use for dilution if you wanted to limit the background absorbance?
The solvent used partly depends on what bands you are looking at. You must choose an appropriate solvent so it is giving you no absorption bands around the peak you are looking for. Carbon tetrachloride is a good solvent because it is quite transparent in a lot of mid-infrared, but it is quite toxic, so you must be careful when using it.
If you have any further questions, you can contact Dr Fawzi Abou-Chahine.


