Webinar Highlights – Your UV/Vis Application Questions Answered
Dr Derek C. Lenz from Mettler-Toledo answers all your webinar questions about UV/Vis applications in life sciences
8 Aug 2021
UV/Vis spectrophotometry is a common technique used for qualitative and quantitative analyses, for a wide range of applications, and forms an indispensable part of any life sciences lab. In the webinar titled ‘Life Sciences Applications in UV/VIS Spectroscopy’, Dr Derek C. Lenz, a UV/Vis Technology and Applications Consultant at Metter-Toledo, reviewed the most relevant applications that can be performed with a UV/VIS spectrophotometer, with a specific focus on life sciences.
You can watch the webinar on-demand here.
We received a lot of interesting questions both during and after the event. Dr Lenz answers them all below:
Q: What are the different types of samples that I can analyze by UV/Vis spectrophotometer?
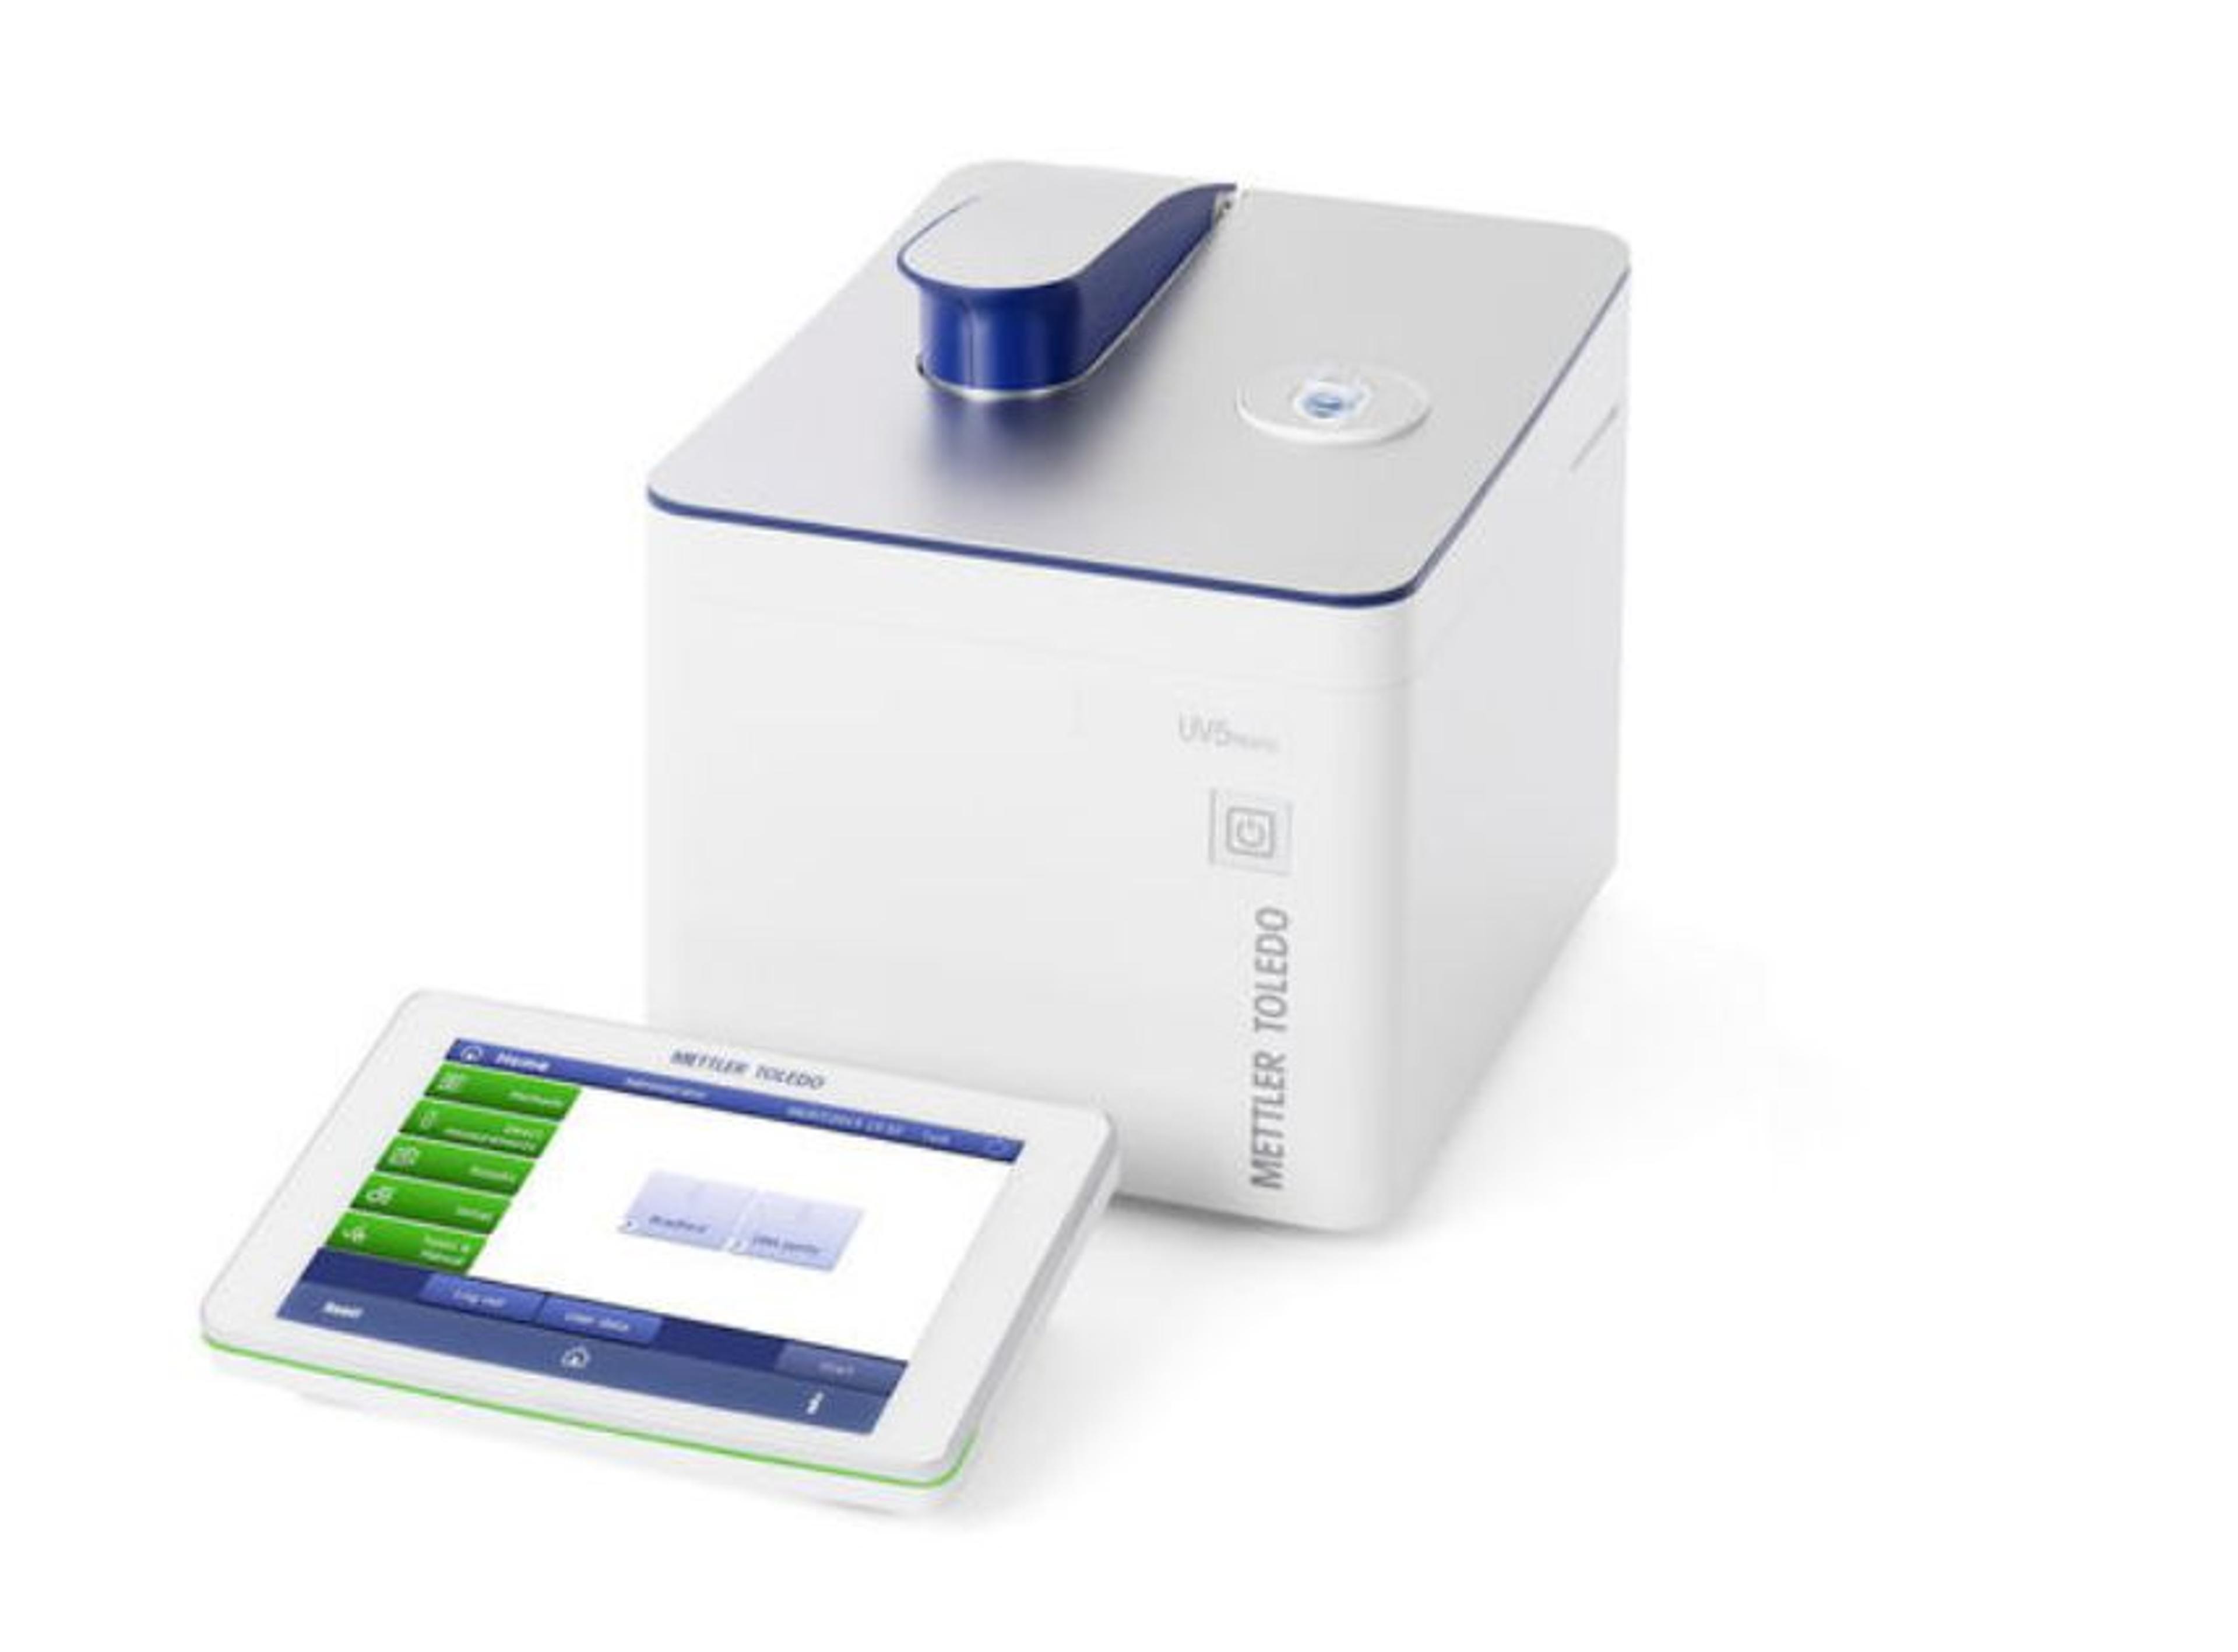
Derek: Our spectrophotometers are equipped with four broad categories: scanning, which scans across the full range of the instrument; fixed wavelength, used for specific measurements like Bradford assays; kinetics, used for enzyme reaction rate measurements; and concentration determination of cell suspensions, used for turbidity measurements, for example, in bacterial growth. Using these four features, a variety of applications are possible.
Q: What is the maximum length of the oligo sequence which can be entered in the software to be calculated by the nearest neighbor method?
Derek: Mettler-Toledo UV/Vis instruments can calculate up to 1,000 nucleotide sequences maximum via nearest neighbor.
Q: In addition to DNA measurement, can you discuss color measurement for dyes?
Derek: This Mettler-Toledo webinar focused on life sciences applications, with the more commonly performed applications being DNA concentration, protein concentration, kinetic enzyme analyses and OD600 (cell counting). During our discussion on methods related to protein concentration determination, we covered both direct and indirect versions (BCA, Lowry, Biuret, and so on), and it is the indirect versions that utilize differing dyes. This is because direct protein measurements are not optimal for accuracy and repeatability. Only aromatic amino acids are capable of absorbing ultra-violet energy, and so direct measurements are beholden to the frequency of those in the amino acid sequence of the protein. Proteins that have low frequencies of aromatic amino acids tend to yield heterogeneous results, when repeated measurements are taken. In an effort to improve the accuracy and consistency of those measurements, dyes are employed that bind to aspects such as peptide bonds between amino acids. These procedures yield more accurate and repeatable results.
Besides protein analyses, dyes and other conjugates are often employed for UV/Vis analyses. Many molecules of interest in life science research do not absorb ultra-violet or visible energies directly. So, in order to analyze such molecules, they are often conjugated to a chromophore or dye that does absorb UV and/or Vis energies. For example, vitamin C analysis via UV/Vis is difficult because ascorbic acid is photo-labile. As such, researchers conjugate vitamin C molecules with a red dye at a 1:1 ratio, measuring that as a surrogate for the target analyte. Similar processes for other molecules are described in the literature.
Q: How does the BCA test detect proteins? How does it react to proteins or amino acids?
Derek: In the BCA assay, the peptide bonds present in all proteins reduce ions from the copper sulfate present in the dye, and do so approximately at a 1:1 ratio. Thereafter, the bicinchoninic acid chelates the copper, forming a purple-colored complex that is analyzed at 562 nm.
Q: Can you differentiate between good sensitivity (Lowry test) from high sensitivity (BCA test)?
Derek: Questions about what is ‘good’ or ‘bad’ with respect to measurement sensitivity and repeatability are difficult to answer, and this is because those parameters are ultimately determined by the goals of the customer organization. In other words, the answer is very different in the context of a QC group in pharmaceuticals, as compared to the R&D goals of a petrol start-up company.
Assuming a scenario of a UV/Vis application in a pharmaceutical environment with a high regulatory burden, good sensitivity would typically be +/- 1.0% measurements against a certified standard as a sample, and repeatability as defined by a relative standard deviation of 2-3% or better. High/great sensitivity would be measurements of +/- 0.1 % with standard deviations of 1% or better. Always bear in mind that sample concentrations are within the linear range of the instrument. Aspects such as solvent suitability, the potential presence of interfering materials, the accuracy of any pipetting steps, and the composition of the cuvette also play a role in those parameters.
Q: What are some other advantages of this UV/Vis technique related to protein?
Derek: First off, UV/Vis is both a qualitative and quantitative analysis, and it is relatively quick, simple and cost-effective to execute, as compared to other applications, such as NMR (expensive) or gel electrophoresis (time-consuming and complex). Depending on the desired levels of accuracy and sensitivity, sample preparation can be anything from minimum (direct protein measurements by UV/Vis) or somewhat involved, such as with indirect applications like BCA or Bradford.
Another advantage of these techniques is the ability to reveal structural aspects of some proteins, such as isomerization, or functional aspects, such as with enzyme kinetic analyses. This application can also be applied to the numerous applications in biological labs, where accurate protein concentrations improve, or are even critical, to executing an application correctly. These could include applications such as peptide synthesis, ELISA, western blots, signal transduction work, cell protein synthesis and more.
An additional advantage is the non-destructive nature of direct protein measurements; samples can be recovered for us in subsequent applications.
Q: How can we more accurately measure the protein concentration of a sample that contains a certain percentage (e.g. 20-40%) of high-order aggregates (e.g. oligomer), which presumably has a different extinction coefficient to its monomer? Any method other than colorimetric assay, since high-order aggregate may not bind to dye in the same ratio as to monomer.
Derek: An interesting question, and one that cites the challenges of measuring high-order aggregates correctly. To add to this, the challenges of measuring antibody-antigen complexes versus unbound antibody and target substrate, or enzyme-substrate complexes, versus the enzyme and cognate substrate separately. All of these scenarios maintain a common challenge.
I have thought about these types of application challenges recently, and I’m considering a couple of ideas, albeit without yet testing their efficacy. One tool might be antibodies conjugated with fluorochromes or dyes that measure at a different part of the spectrum, as compared to the protein assays being used (let’s use BCA at 562 nm as the example). The specificity of the antibody to either the monomer or the oligomer is with a dye that measures at, let’s say, 535 nm (green region). This way, we’re able to differentiate the two targets in the population by looking at two different wave lengths.
Another suggestion might be to use an enzyme that is specific for either the monomer or the oligo, and then look at the product of that reaction colorimetrically. One might also consider Raman spectroscopy or NMR.
Q: Can I use the UV/Vis spectrophotometer in a clinical setting?
Derek: Yes. Many applications in life sciences are very similar to those in a clinical setting. For example, the UV/Vis spectrophotometer can be used to analyze blood samples to test for different analytes in blood, for DNA and protein concentration determination, for cell counts using OD measurements, and so on. The only difference with a clinical setting is that the system and the software should strictly comply with the regulatory needs. For example, the software should be 21 Part 11 CFR compliant, and the instrument should comply with performance verification and equipment qualifications.
Find out more about the Mettler-Toledo’s UV/Vis spectrophotometer.
Can’t live without your UV/Vis spectrophotometer? Share your expertise with other scientists here.