Logger Pro®
Award-winning data-collection and analysis software for Windows and Mac computers

The supplier does not provide quotations for this product through SelectScience. You can search for similar products in our Product Directory.
Great instrument to have around the lab because of its multi purpose capabilities.
Physics, environmental chemistry, general chemistry, forensics
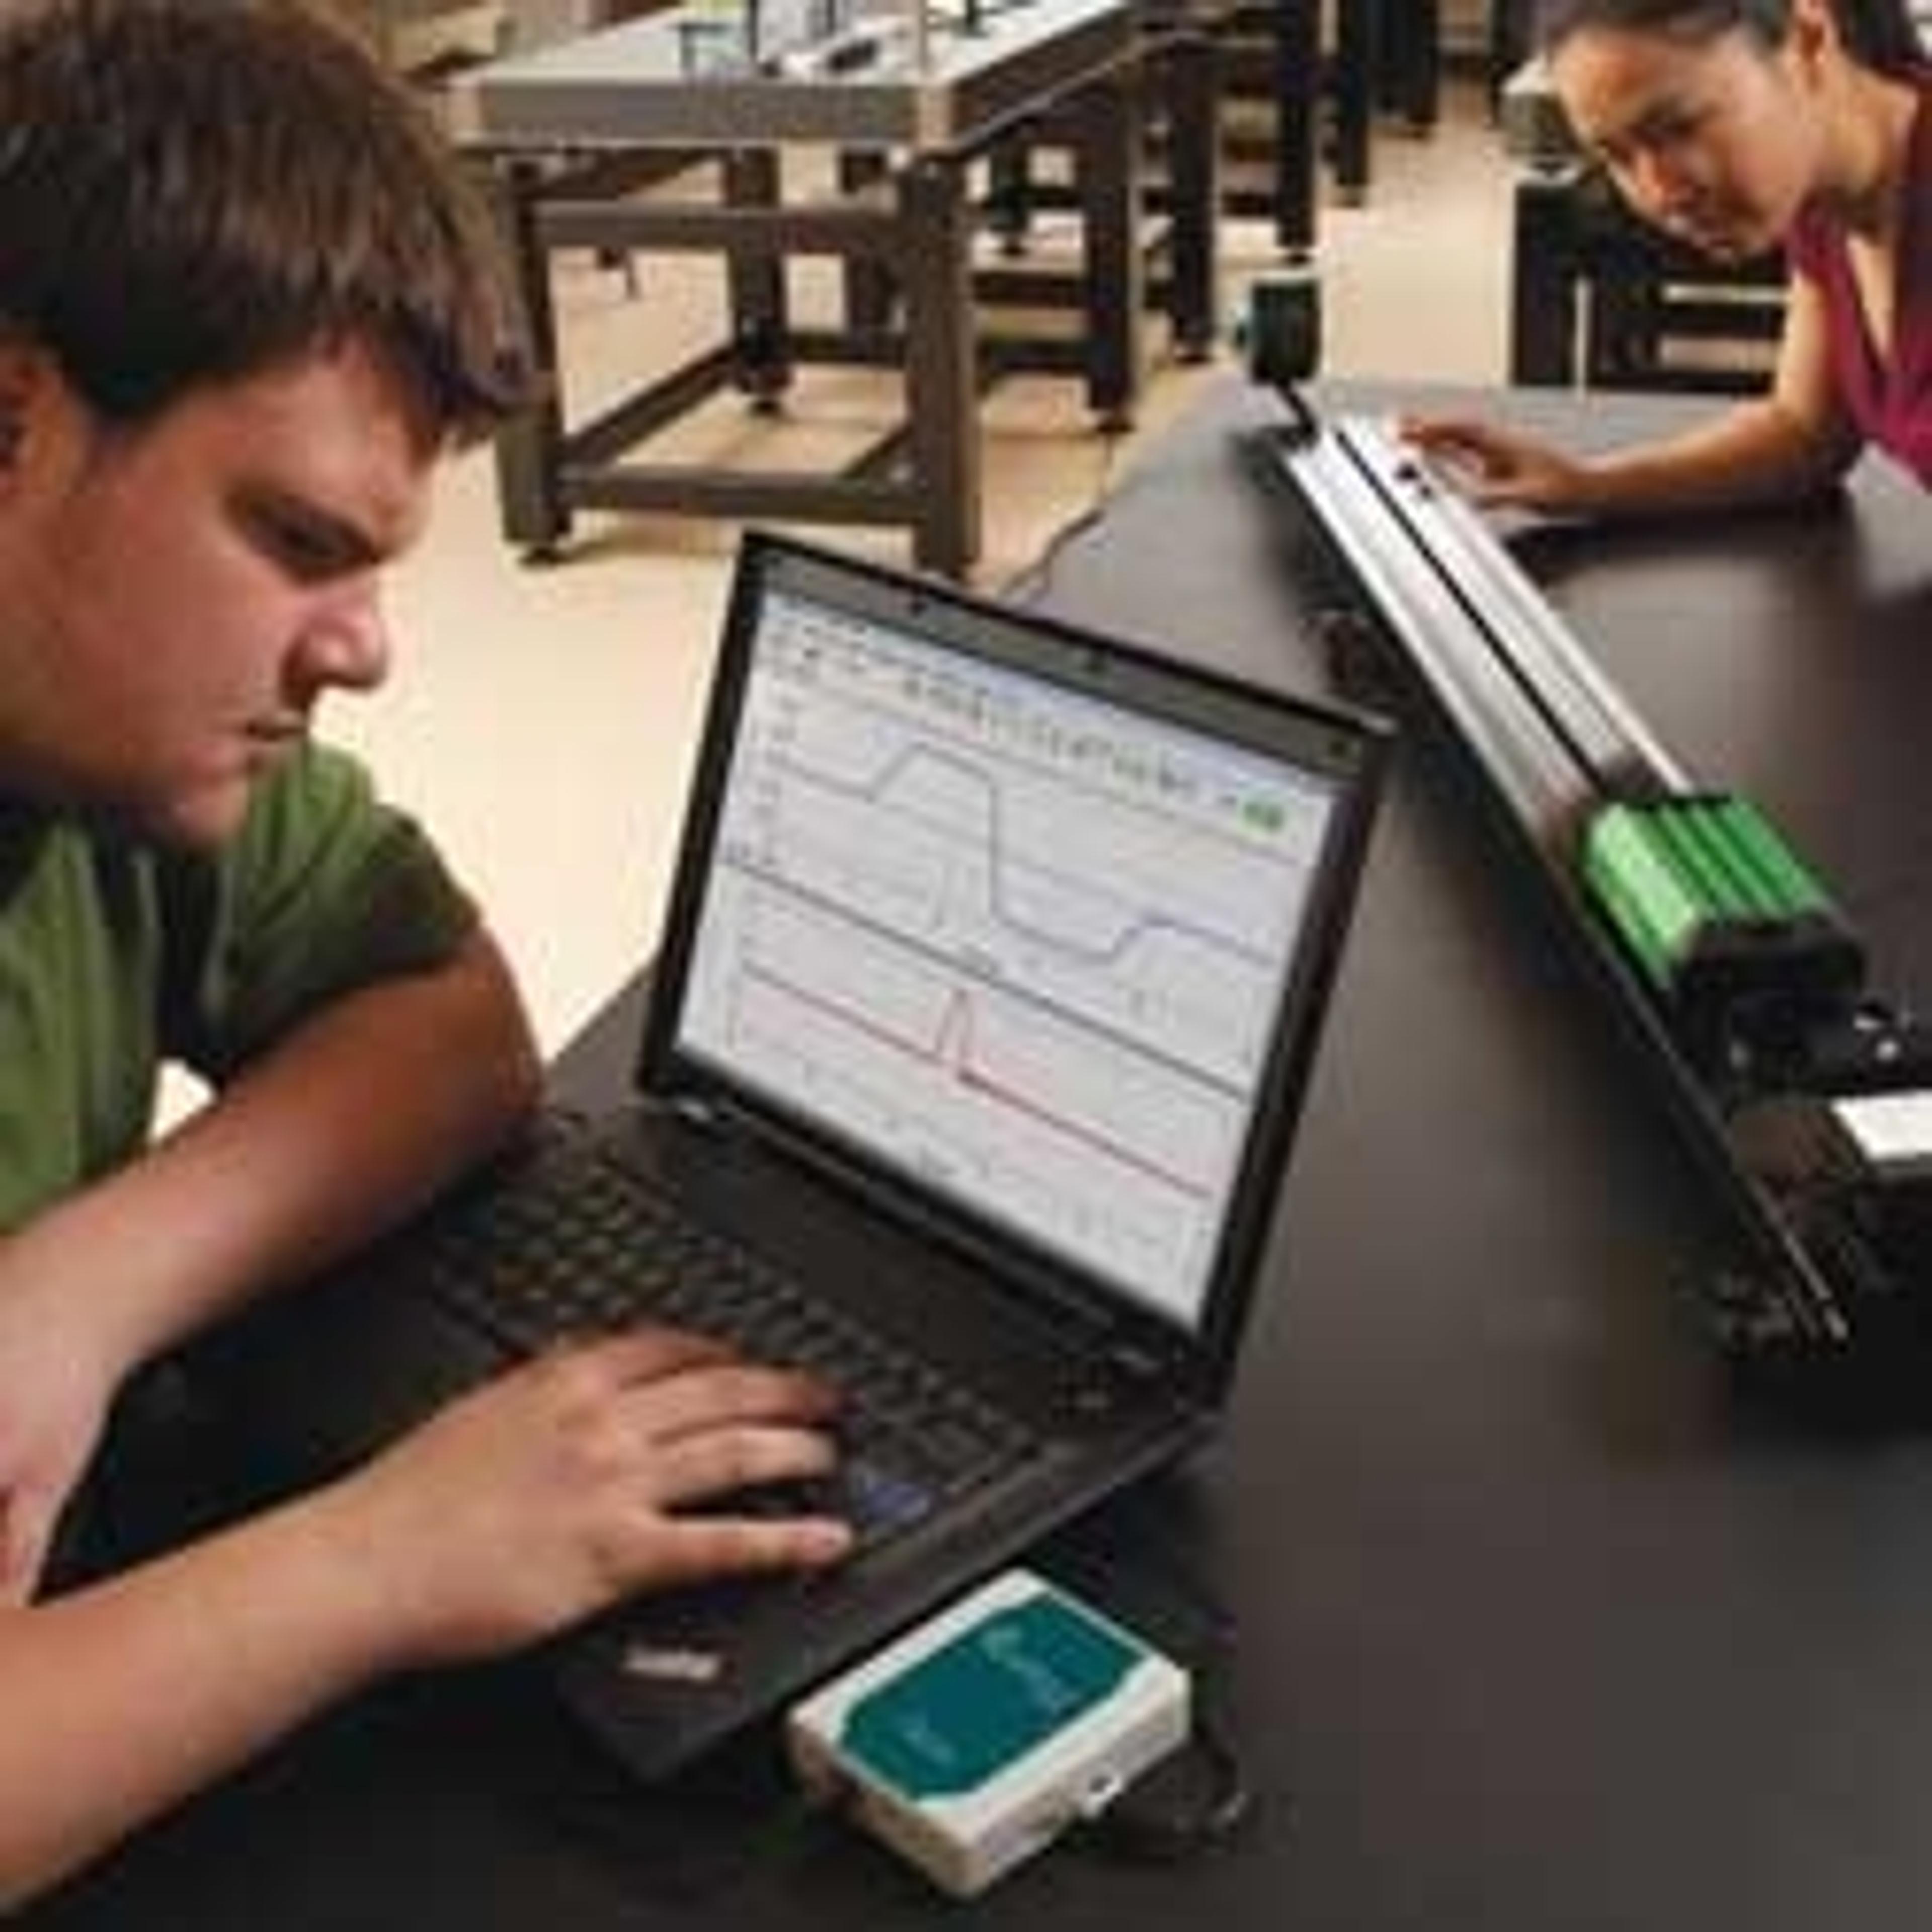
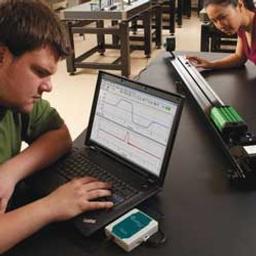
Multiple applications across scientific disciplines ranging from physics to forensic science; whether as a standalone or when interfaced. This instrument can accommodate multiple sensors simultaneously, irrespective of the physical quantity being measured. Very interactive software/hardware - especially when carrying out "graph matching" experiments in physics and “exploring the properties of gases” in chemistry. Great for plotting data points/calibration curves when operated in the events with entry mode. The software allows for the statistical analysis of the data collected. Really good instrument, easy to setup and easy to use.
Review Date: 10 Feb 2020 | Vernier
Reliable and easy to use
Teaching laboratory
Logger Pro is a versatile instrument for chemistry teaching labs. Reliable and easy to use. Training is available from company.
Review Date: 27 Mar 2019 | Vernier
Wonderful accessories for students!
Student accessible pH meters
These meters were very accurate and durable. As a student aide I found the fact that they were easy to clean and set up crucial.
Review Date: 7 Mar 2017 | Vernier
Basic Features
- Auto-ID sensors make setup effortless
- Collect live data from more than 80 different sensors and devices
- Draw predictions on a graph before collecting data
- Use a variety of data-collection modes, as needed, for your experiment: time-based data, selected events, events with typed-in entries, photogate, radiation counting, and more
- Manually enter data for graphing and analysis
- Import data from Vernier interfaces
- Lay out graphs, tables, and text as needed across multiple pages to describe your experiment
- Read values and slope from graphs using examine and tangent line tools
- Print graphs and data tables
Advanced Features
- XY graphs, log graphs, double-Y graphs, strip charts, and FFT graphs
- Model data with user-adjustable functions
- Extract data from movies using frame-by-frame video analysis
- Capture videos from DV cameras and web cameras
- Play back movies synced to sensor data
- Gel electrophoresis analysis
- Calculated columns allow you to graph new quantities such as kinetic energy
- Time of day and date stamps for graphing
- Ocean Optics spectrometer support
- GPS support
- GC peak analysis
- Manual configuration mode for IB courses