OneSource Laboratory Descriptive Analytics and Interactive Dashboards Services
Data driven recommendations you need to make decisions on your lab equipment fleet with our suite of holistic lab and asset analytics delivered to you through the app, web portal, and interactive visualizations / dashboards.

The supplier does not provide quotations for this product through SelectScience. You can search for similar products in our Product Directory.
Interactive dashboards
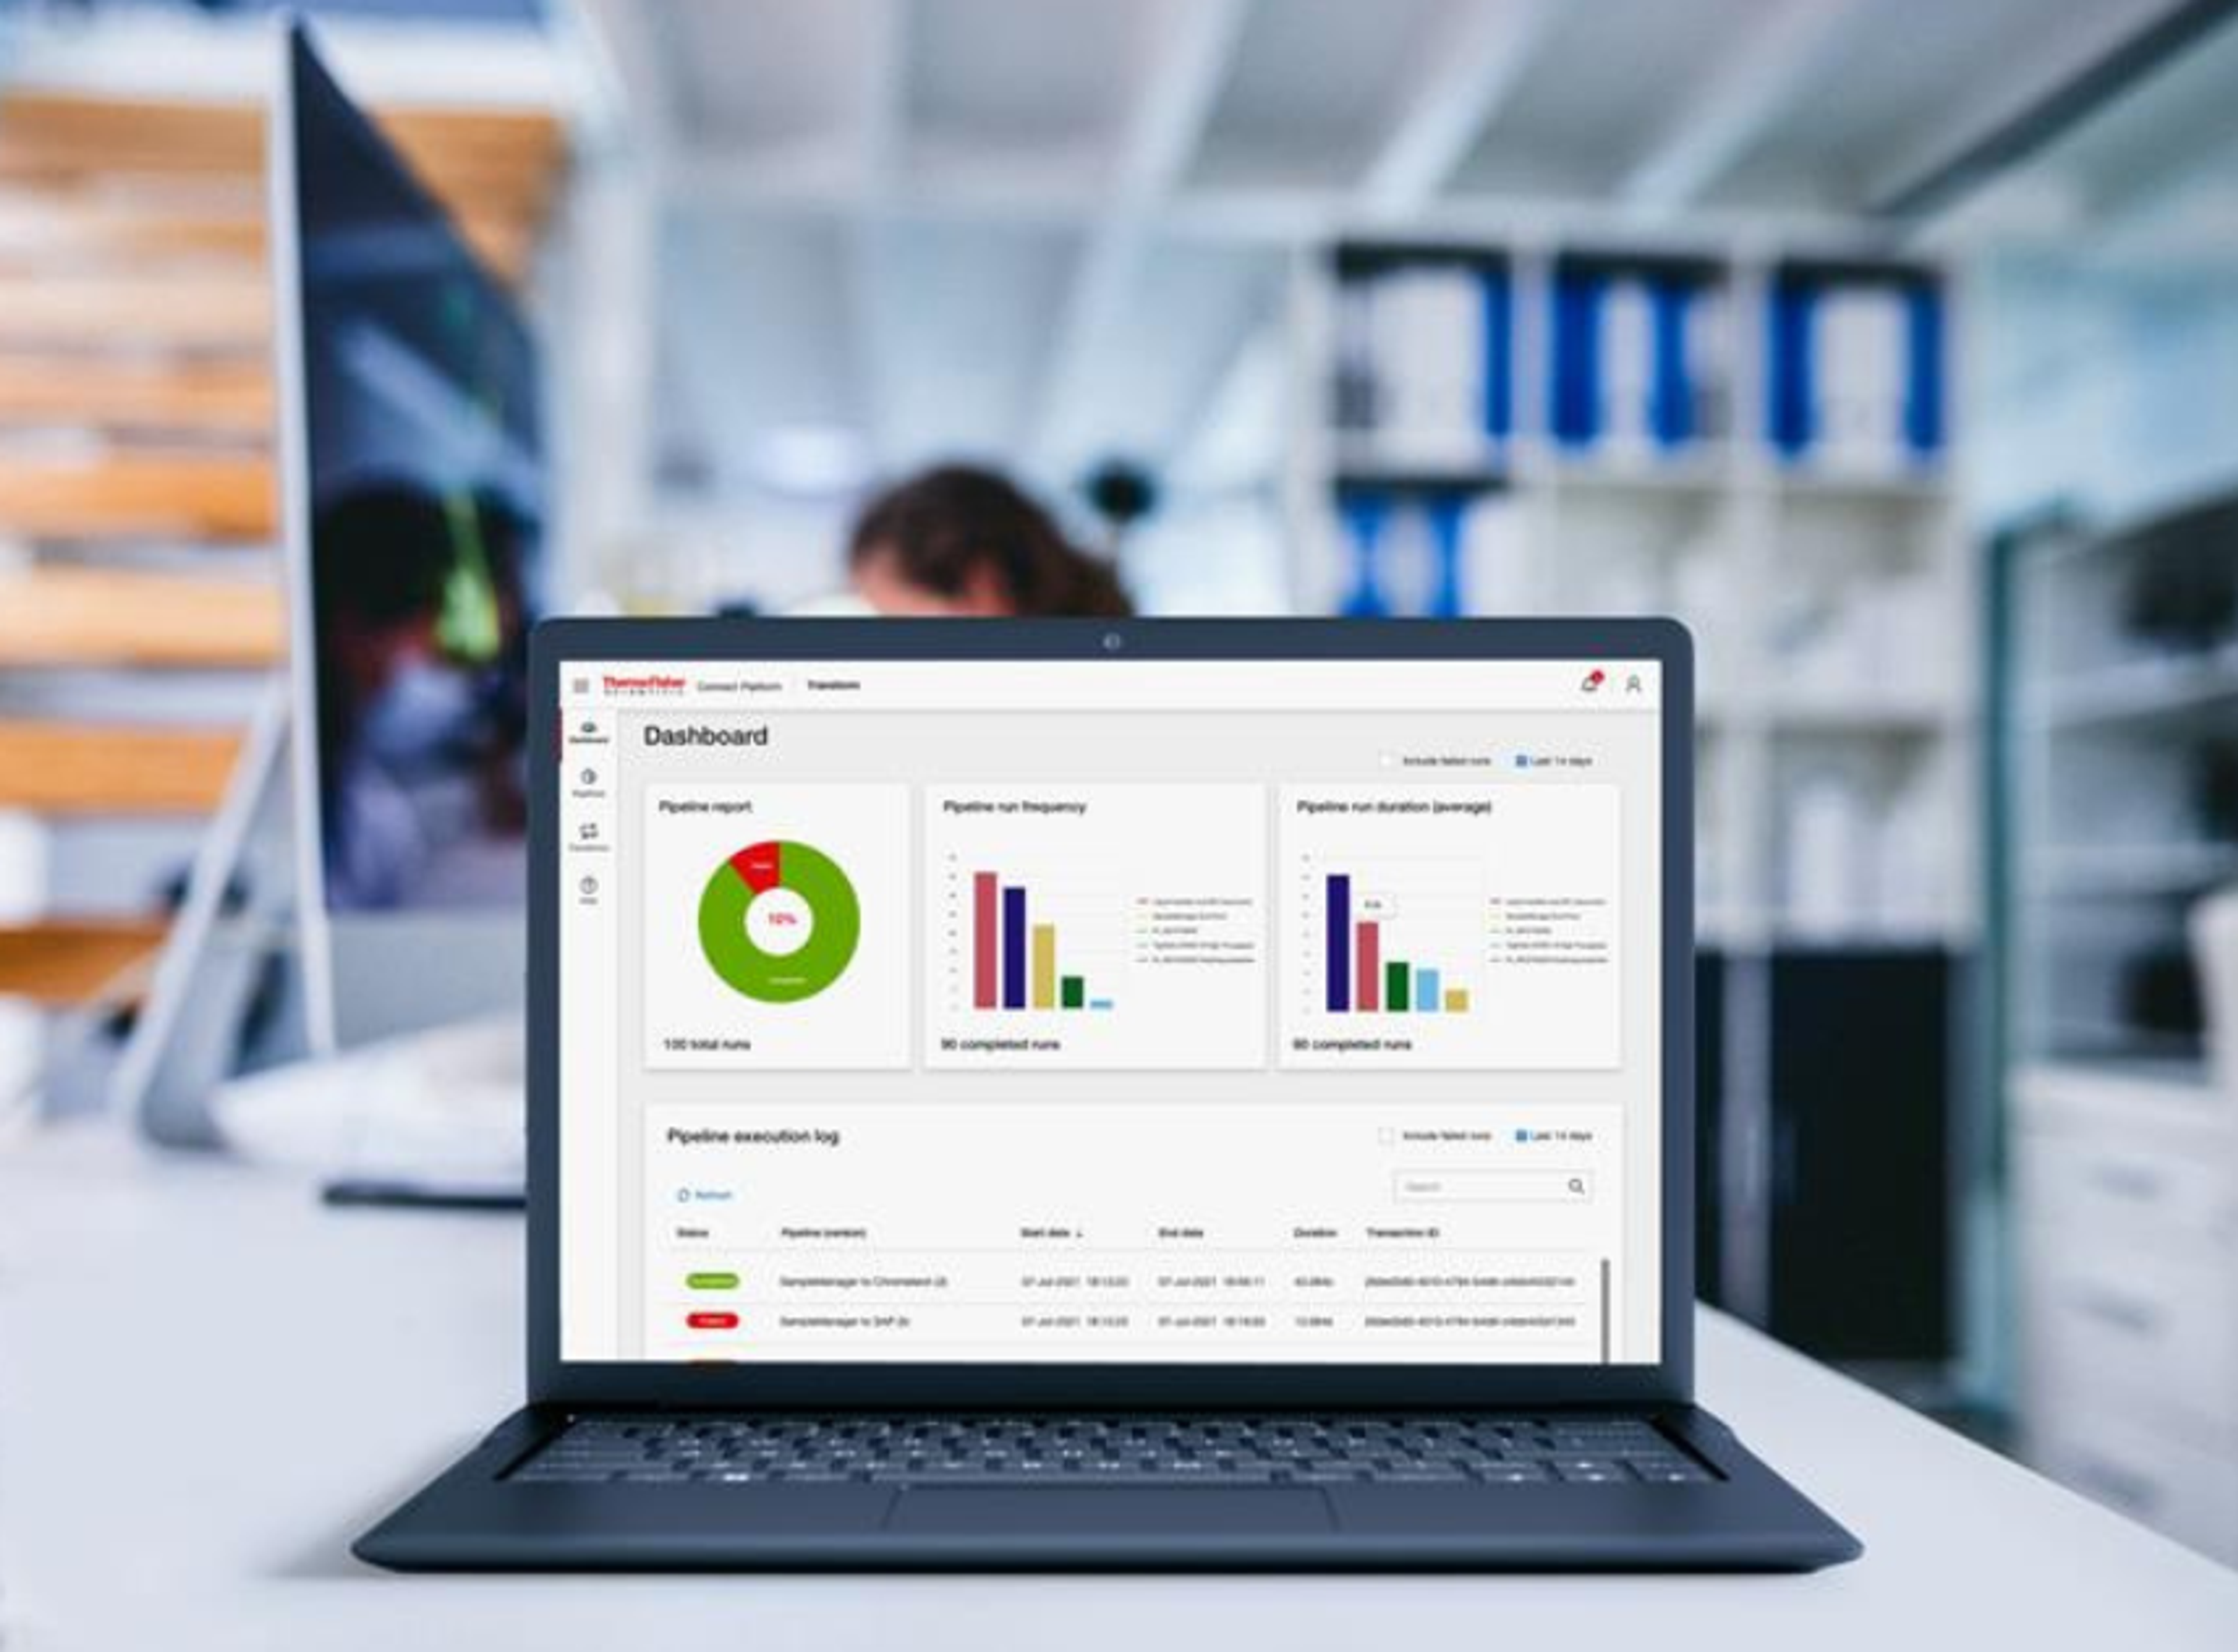
OneSource Dashboards uses powerful reporting and visualization techniques to provide you with an interactive way to analyze your laboratory data like asset inventory and density, location, service history, KPI's, utilization and much more. Using the comprehensive multi-dimensional reporting capability features, you can gain deeper insights into your lab’s data and a comprehensive view of your lab‘s operations.
Mobile and web access
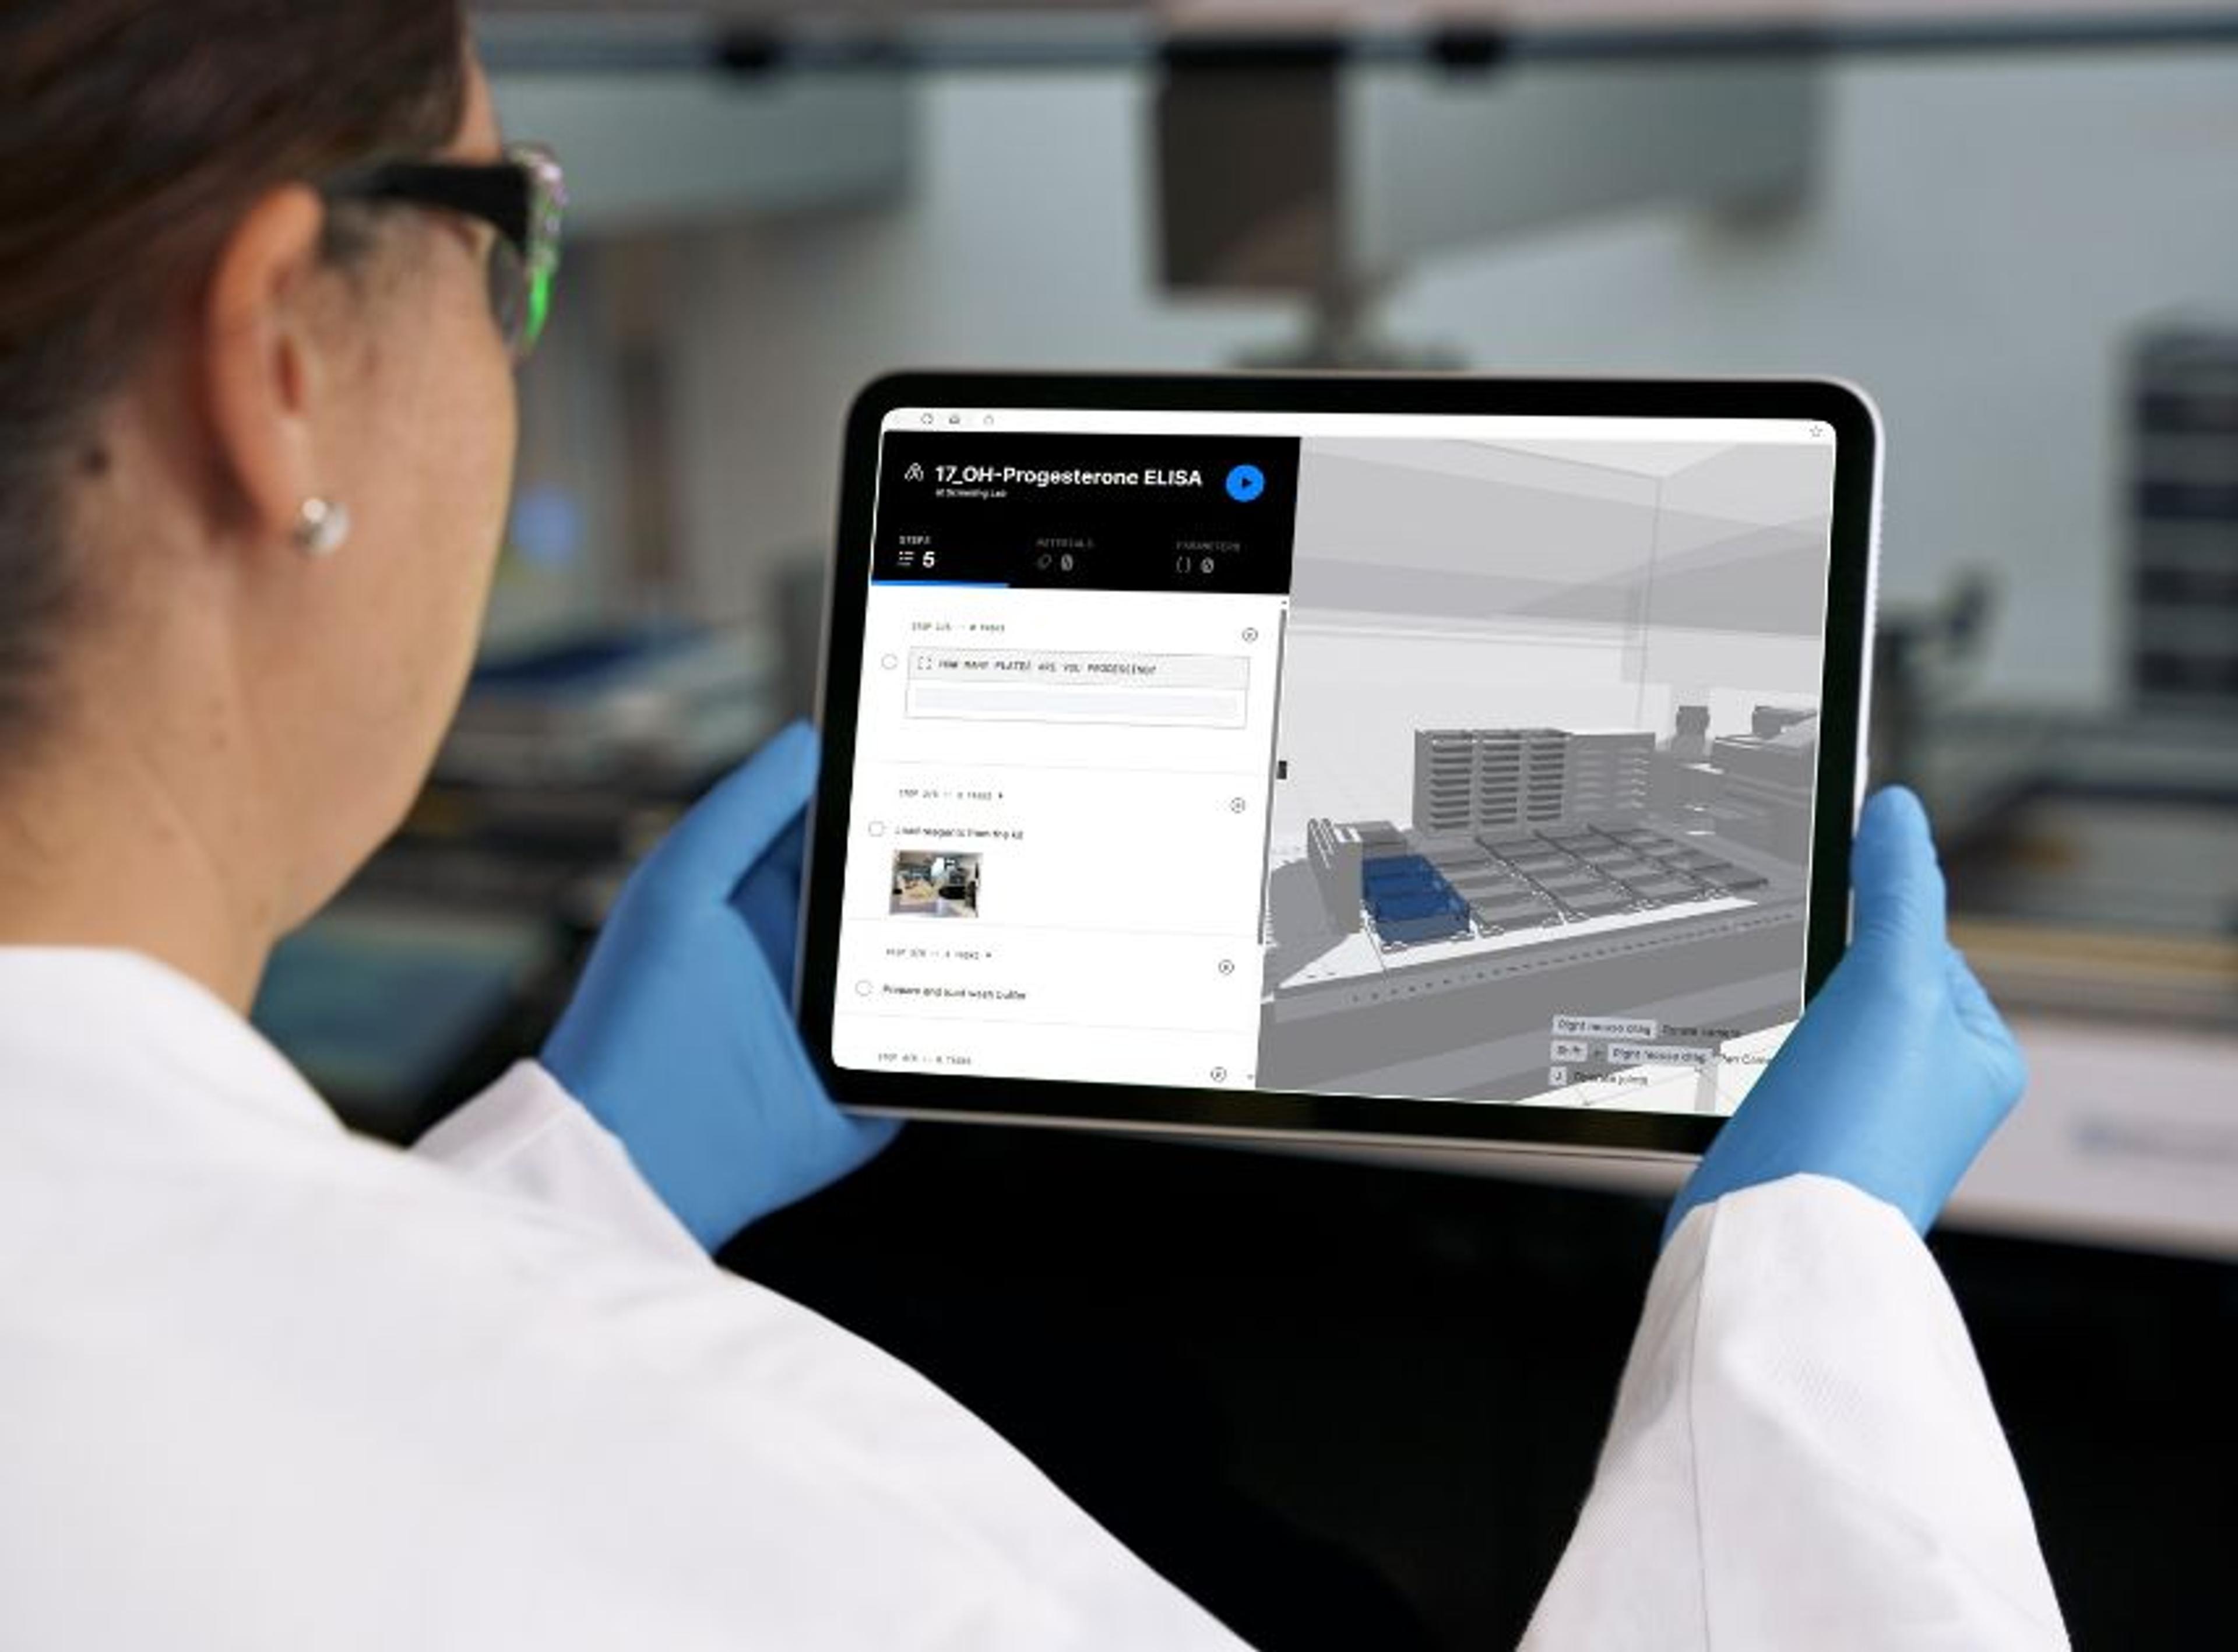
OneSource Platform offers convenient access to asset and service data in real time, regardless of the instrument location. Accessible via the Web Portal or Mobile App, customizable dashboards allow users to view and analyze data to minimize bottlenecks and ensure instruments are up and running.
Global benchmarking
With OneSource Global Benchmarking dashboards, you can not only analyze asset performance across internal labs, but also against peers, allowing you to make informed decisions on decommissioning, acquisition and areas of improvement.

