ResourceLab Informatics
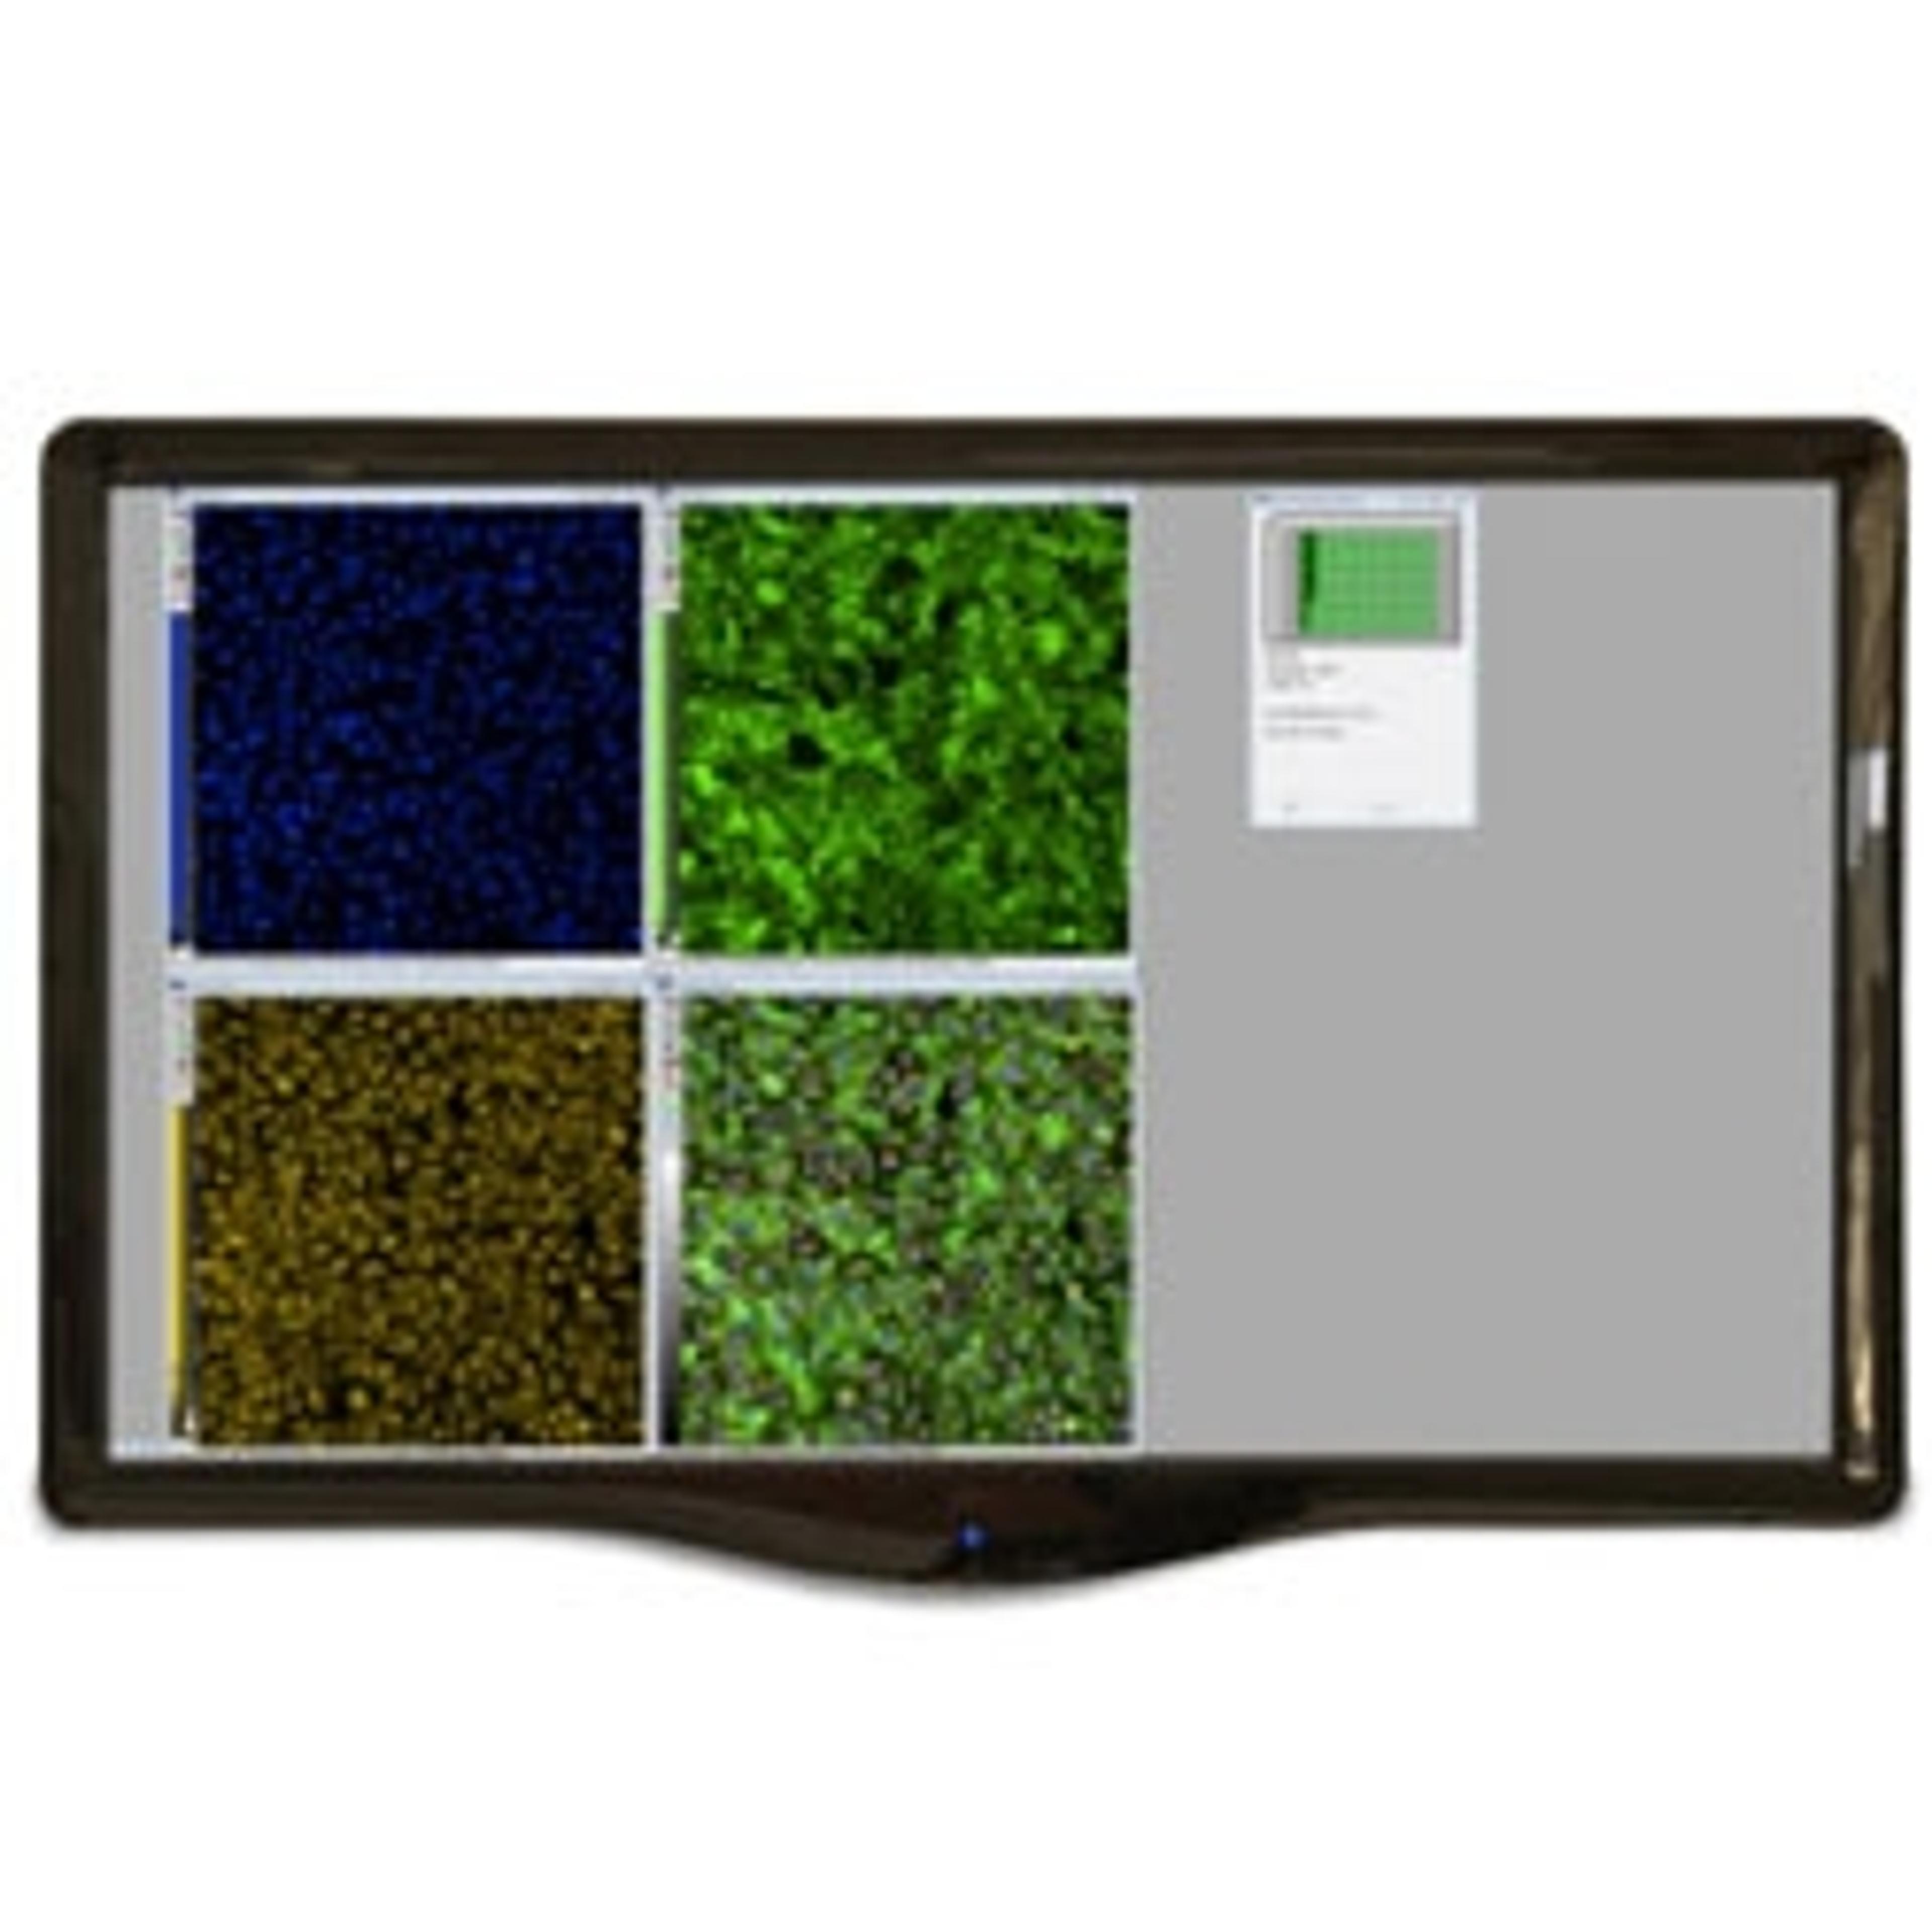
Analyze Experimental Results Using Curve Fitting with MetaXpress 6.5 Software
21 Mar 2019The new Curve Fitting Algorithms in the MetaXpress® 6.5 (MX 6.5) HighContent Image Acquisition and Analysis Software were designed to facilitate data visualization and the secondary analysis of data. The software allows you to generate a curve of best fit to a series of data points. With multiple functions, including 4-parameter logistic, and multiple curve outputs, such as EC50 and benchmark response, an array of graphs and curves can be generated to best represent data. Here, we show how to generate doseresponse relationship for defining the EC50 values of compounds using a toxicity assay as an example.