Fast, reliable and live characterization of materials using novel color technology
Find out why combining SEM and EDS into a single new tool has materials scientists excited
17 Mar 2020
To determine the micro-scale chemical composition of materials, scientists typically use a scanning electron microscope (SEM) that scans samples with a beam of electrons. From the backscattered and secondary electrons, SEM provides visual information about sample composition and topography presented in greyscale contrasts. To further obtain elemental information on specific areas of the sample, scientists perform additional analysis using EDS (energy-dispersive X-ray spectroscopy) that generates elemental maps from the emitted X-rays.
Although widely used to characterize materials, current workflows combining SEM with EDS can be better optimized to offer tighter integration between the two techniques. For instance, EDS often runs on a separate computer, requiring scientists to switch between systems for the same experiment. Plus, setting up EDS and acquiring data, in addition to SEM, takes more time. SEM and EDS systems may come from different vendors, making it difficult to integrate data. Moreover, the complexity involved in performing EDS relies on technical expertise, overwhelming new users.
But that’s all about to change…
SEM and EDS analysis built into a single tool: ColorSEM technology
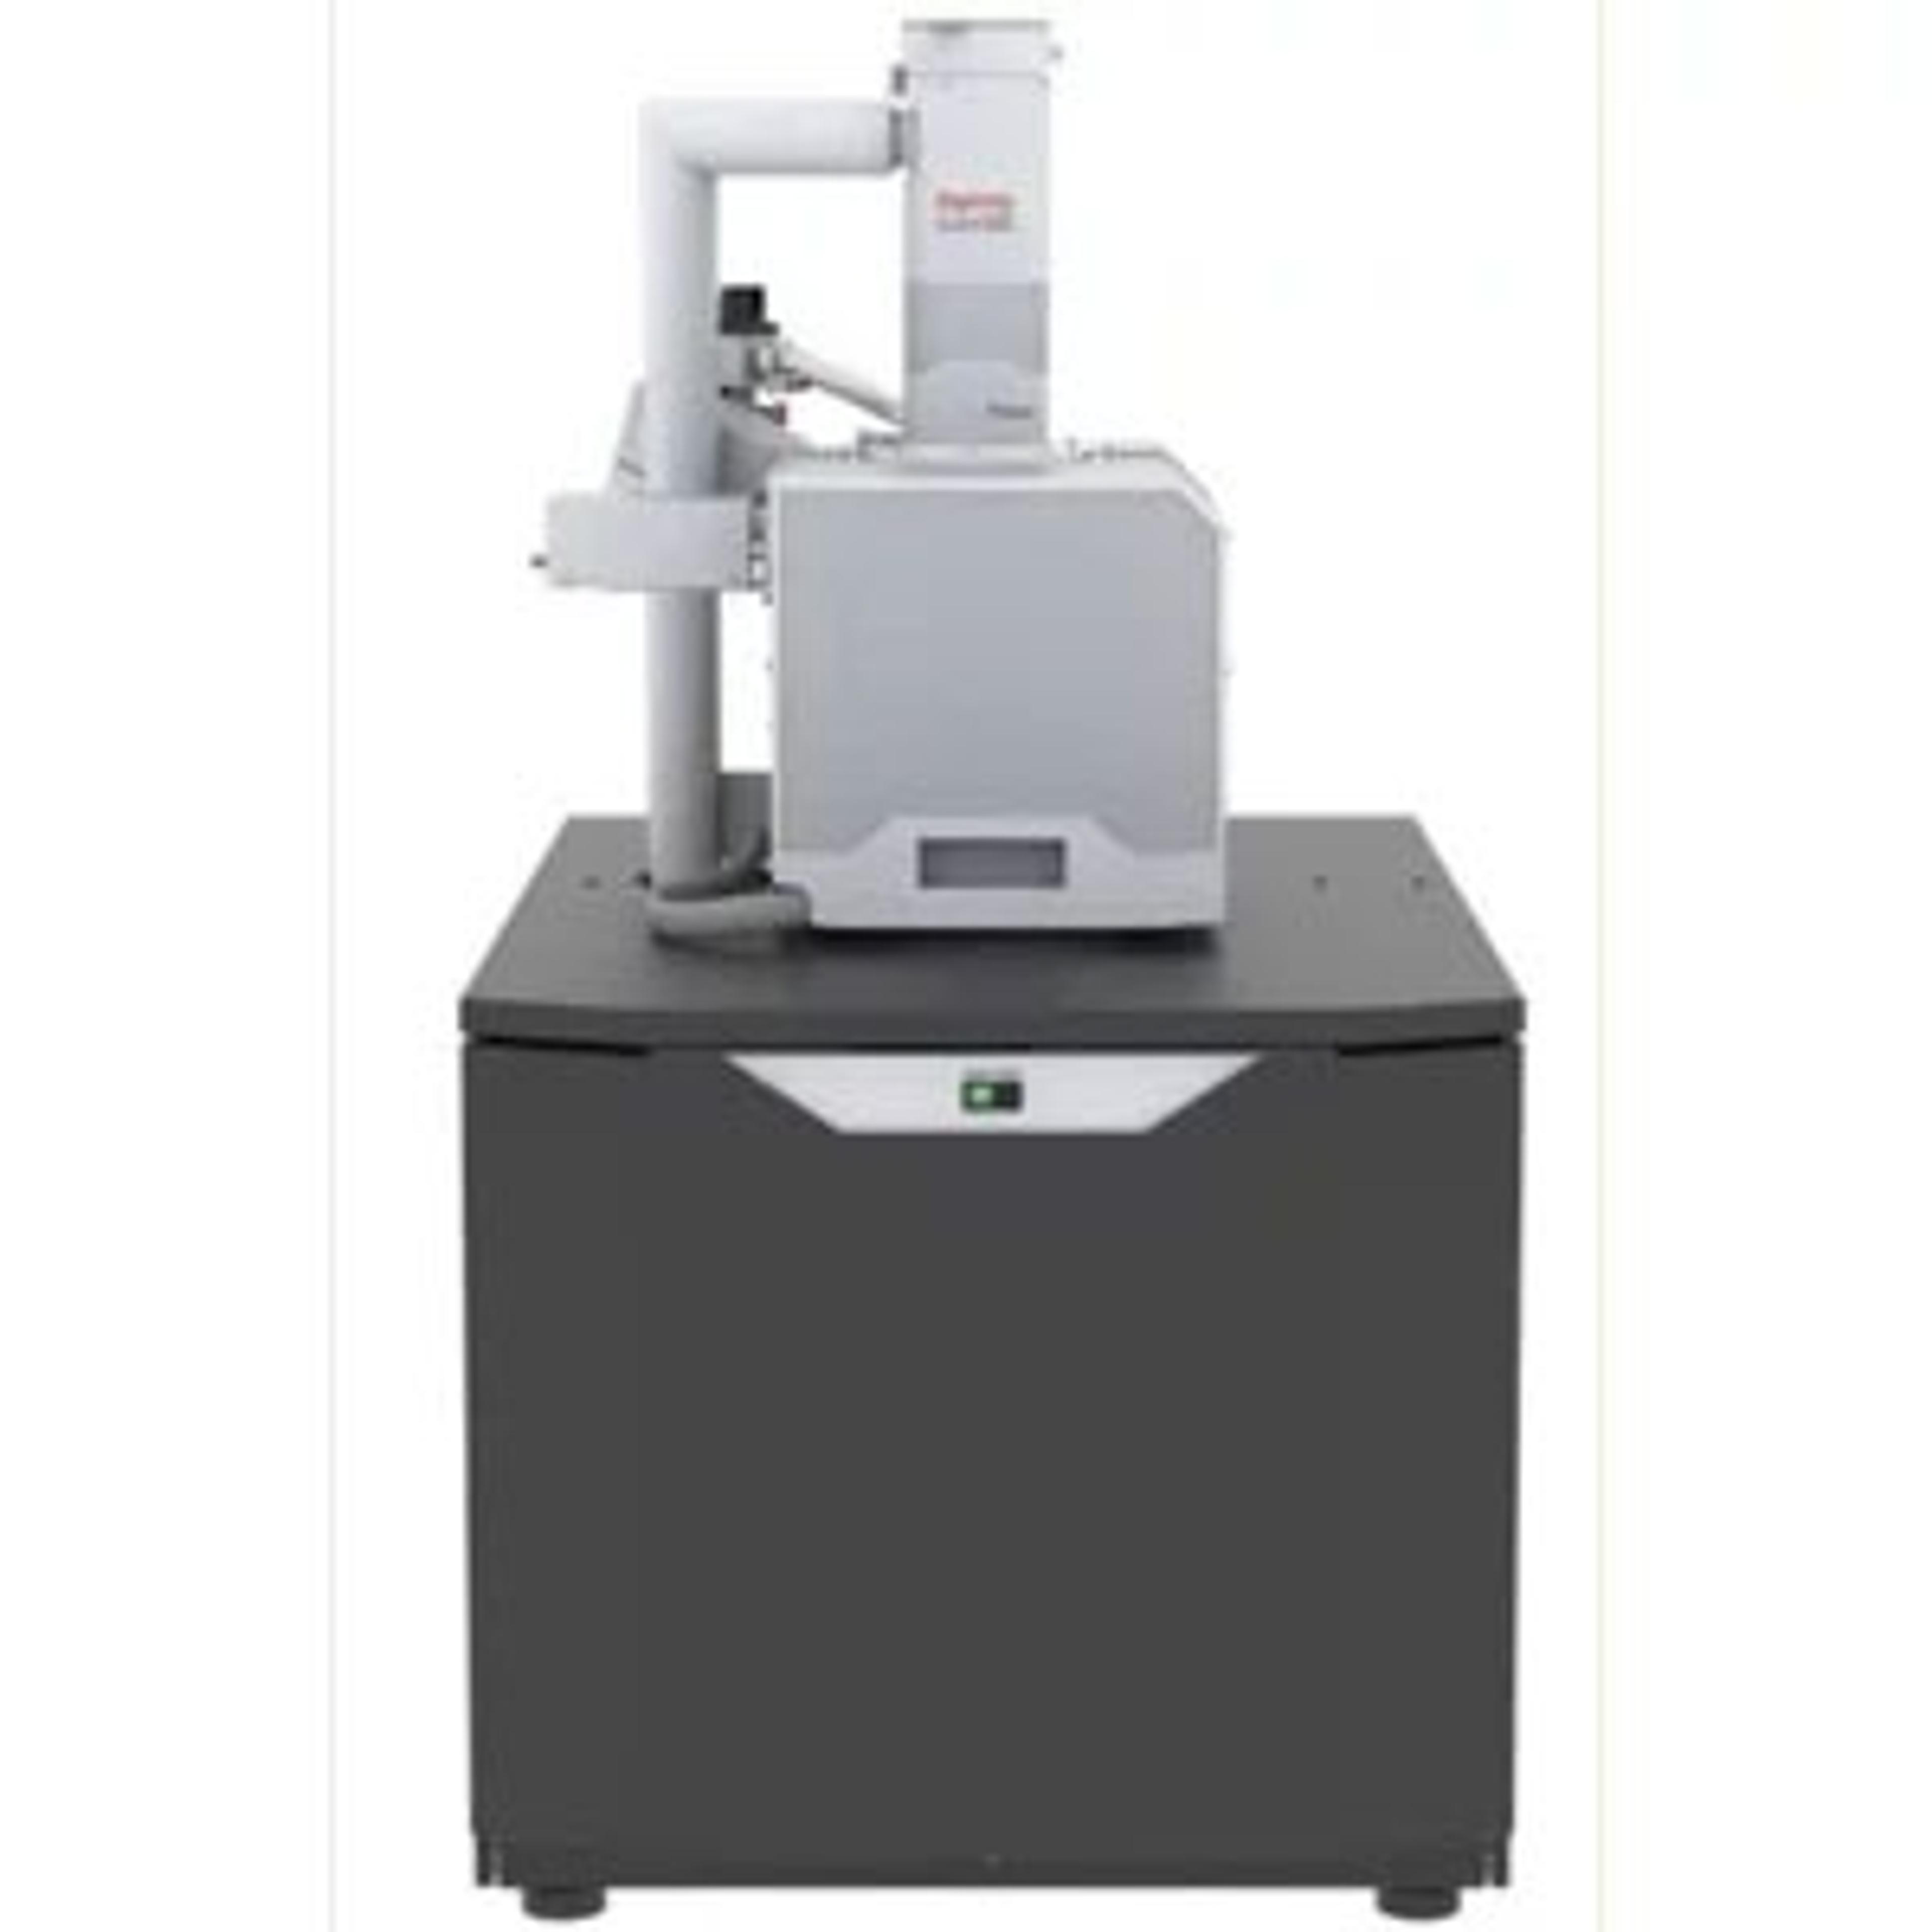
A new technology launched by Thermo Fisher Scientific combines SEM and EDS into a single tool. With color EDS analysis integrated with SEM imaging, the Thermo Scientific™ ColorSEM™ Technology offers chemical information in color while addressing the challenges previously associated with EDS.
Available on current Thermo Fisher Scientific SEM instruments, ColorSEM fully integrates EDS into the user interface, eliminating the need to switch between systems. Coming from one vendor, the SEM and EDS technologies can work together in a hassle-free, intuitive and compatible manner.
Compared to traditional EDS workflows, ColorSEM is up to 10x faster in deriving relevant elemental information using proprietary electron and X-ray data processing algorithms. With compositional maps shown in vivid colors, ColorSEM is “always on,” observing contrasts that can otherwise go unnoticed. The live display prevents the need for switching interfaces. With EDS data stored in every scanning experiment, researchers benefit from improved productivity. Plus, an easy-to-use interface means minimal training, expanding the number of users and facilitating cross-disciplinary research.
Generating fast, accurate and real-time elemental maps
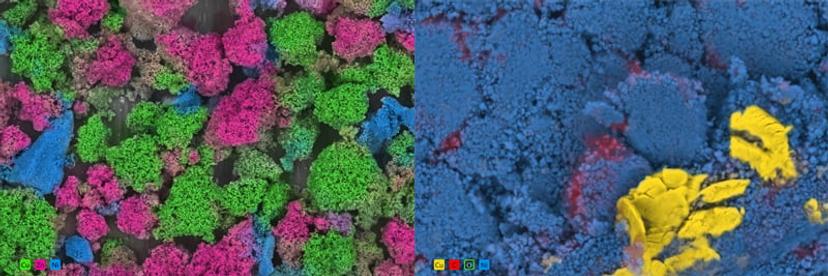
Obtaining quantitative EDS maps, an otherwise somewhat laborious process, requires a rather simple step on ColorSEM: click the ‘Color’ button on the interface to see the live elemental composition. The elements contained in the sample material are identified and separated into different colors within an image, creating a real-time map of their precise location. Live elemental display is not limited to slow scans – even during TV-rate scanning with dwell times in the tens-of-nanoseconds range, quantitative elemental information is shown.
“It’s saving me an enormous amount of time,” says Dennis Manuel, of Houston Electron Microscopy, a contract-based laboratory that supports the petrochemical, oil and gas industries with materials characterization. Describing an application in his lab, Manuel explains how ColorSEM helps to analyze the types of clays in geological core samples to make informed decisions about drilling. Being hard to distinguish using only morphological characteristics, Manuel uses ColorSEM to identify and verify the different clays in his samples.
The precision offered by ColorSEM can be attributed to the built-in image processing capabilities, namely, the object-based image segmentation and dynamic pixel binning. In traditional EDS mapping, no image processing occurs, resulting in coarse images without detailed features. Because ColorSEM automatically generates object-based segments from the raw EDS and SEM images, the resulting features are sharper and acquired in a shorter time. Moreover, the proprietary shadow detection algorithm ensures that only areas with enough statistics are colored.
In addition to live composition-based color imaging, ColorSEM offers tools for obtaining localized elemental information such as “point and ID” to focus on a spot, or linescan to analyze the sample along a line, and regional mapping for selected regions.
The diverse applications of ColorSEM
With a diverse range of applications in different industries, including geoscience, research on semiconductors, batteries, construction materials and steel, to name a few, the ColorSEM technology can speed up analysis, making experimental workflows much faster than traditional ones. We hear from researchers across the globe as they share their first impressions of the live demos with the Thermo Scientific™ Prisma E SEM with ColorSEM technology at M&M 2019 in Portland:
“The ColorSEM seems to be a very nice feature of the microscope because it’s really fast – you don’t have to wait for post-processing,” says Dr. Cedric Barroo, of Universite Libre de Bruxelles whose lab focuses on the dynamics of catalyzed reactions using in situ material characterization.
Dr. Lifeng Dong, Professor at Hamline University, Minnesota, who fabricates and characterizes nanoscale materials, tested the ColorSEM to study solar cells and lithium batteries. The simultaneous imaging of electrons and X-rays brought immense value to his experiments. “In the past, you had to switch from different imaging modes, for example, from backscattered to EDS mode,” notes Dong. “But now, it’s much faster.”
Meanwhile, at the Mexican Petroleum Institute, Dr. Carlos Angeles Chavez, who analyzes catalytic materials and fossil fuel pollutants, appreciated obtaining information on the chemical composition and morphology in real time. “Everything is displayed in near real time on the screen,” says Chavez. “It’s fundamental for me because we always have different morphologies with different compositions, and to know this immediately is fabulous.”
With SEM and EDS combined into a single tool, scientists can now benefit from fast, live color mapping that significantly speeds up the research process in materials science. ColorSEM provides a precise, in-depth characterization of materials without ever having to master the complicated EDS analysis.
To learn more about obtaining instantaneous elemental information using the Thermo Scientific™ ColorSEM™ Technology, watch this on-demand webinar>>