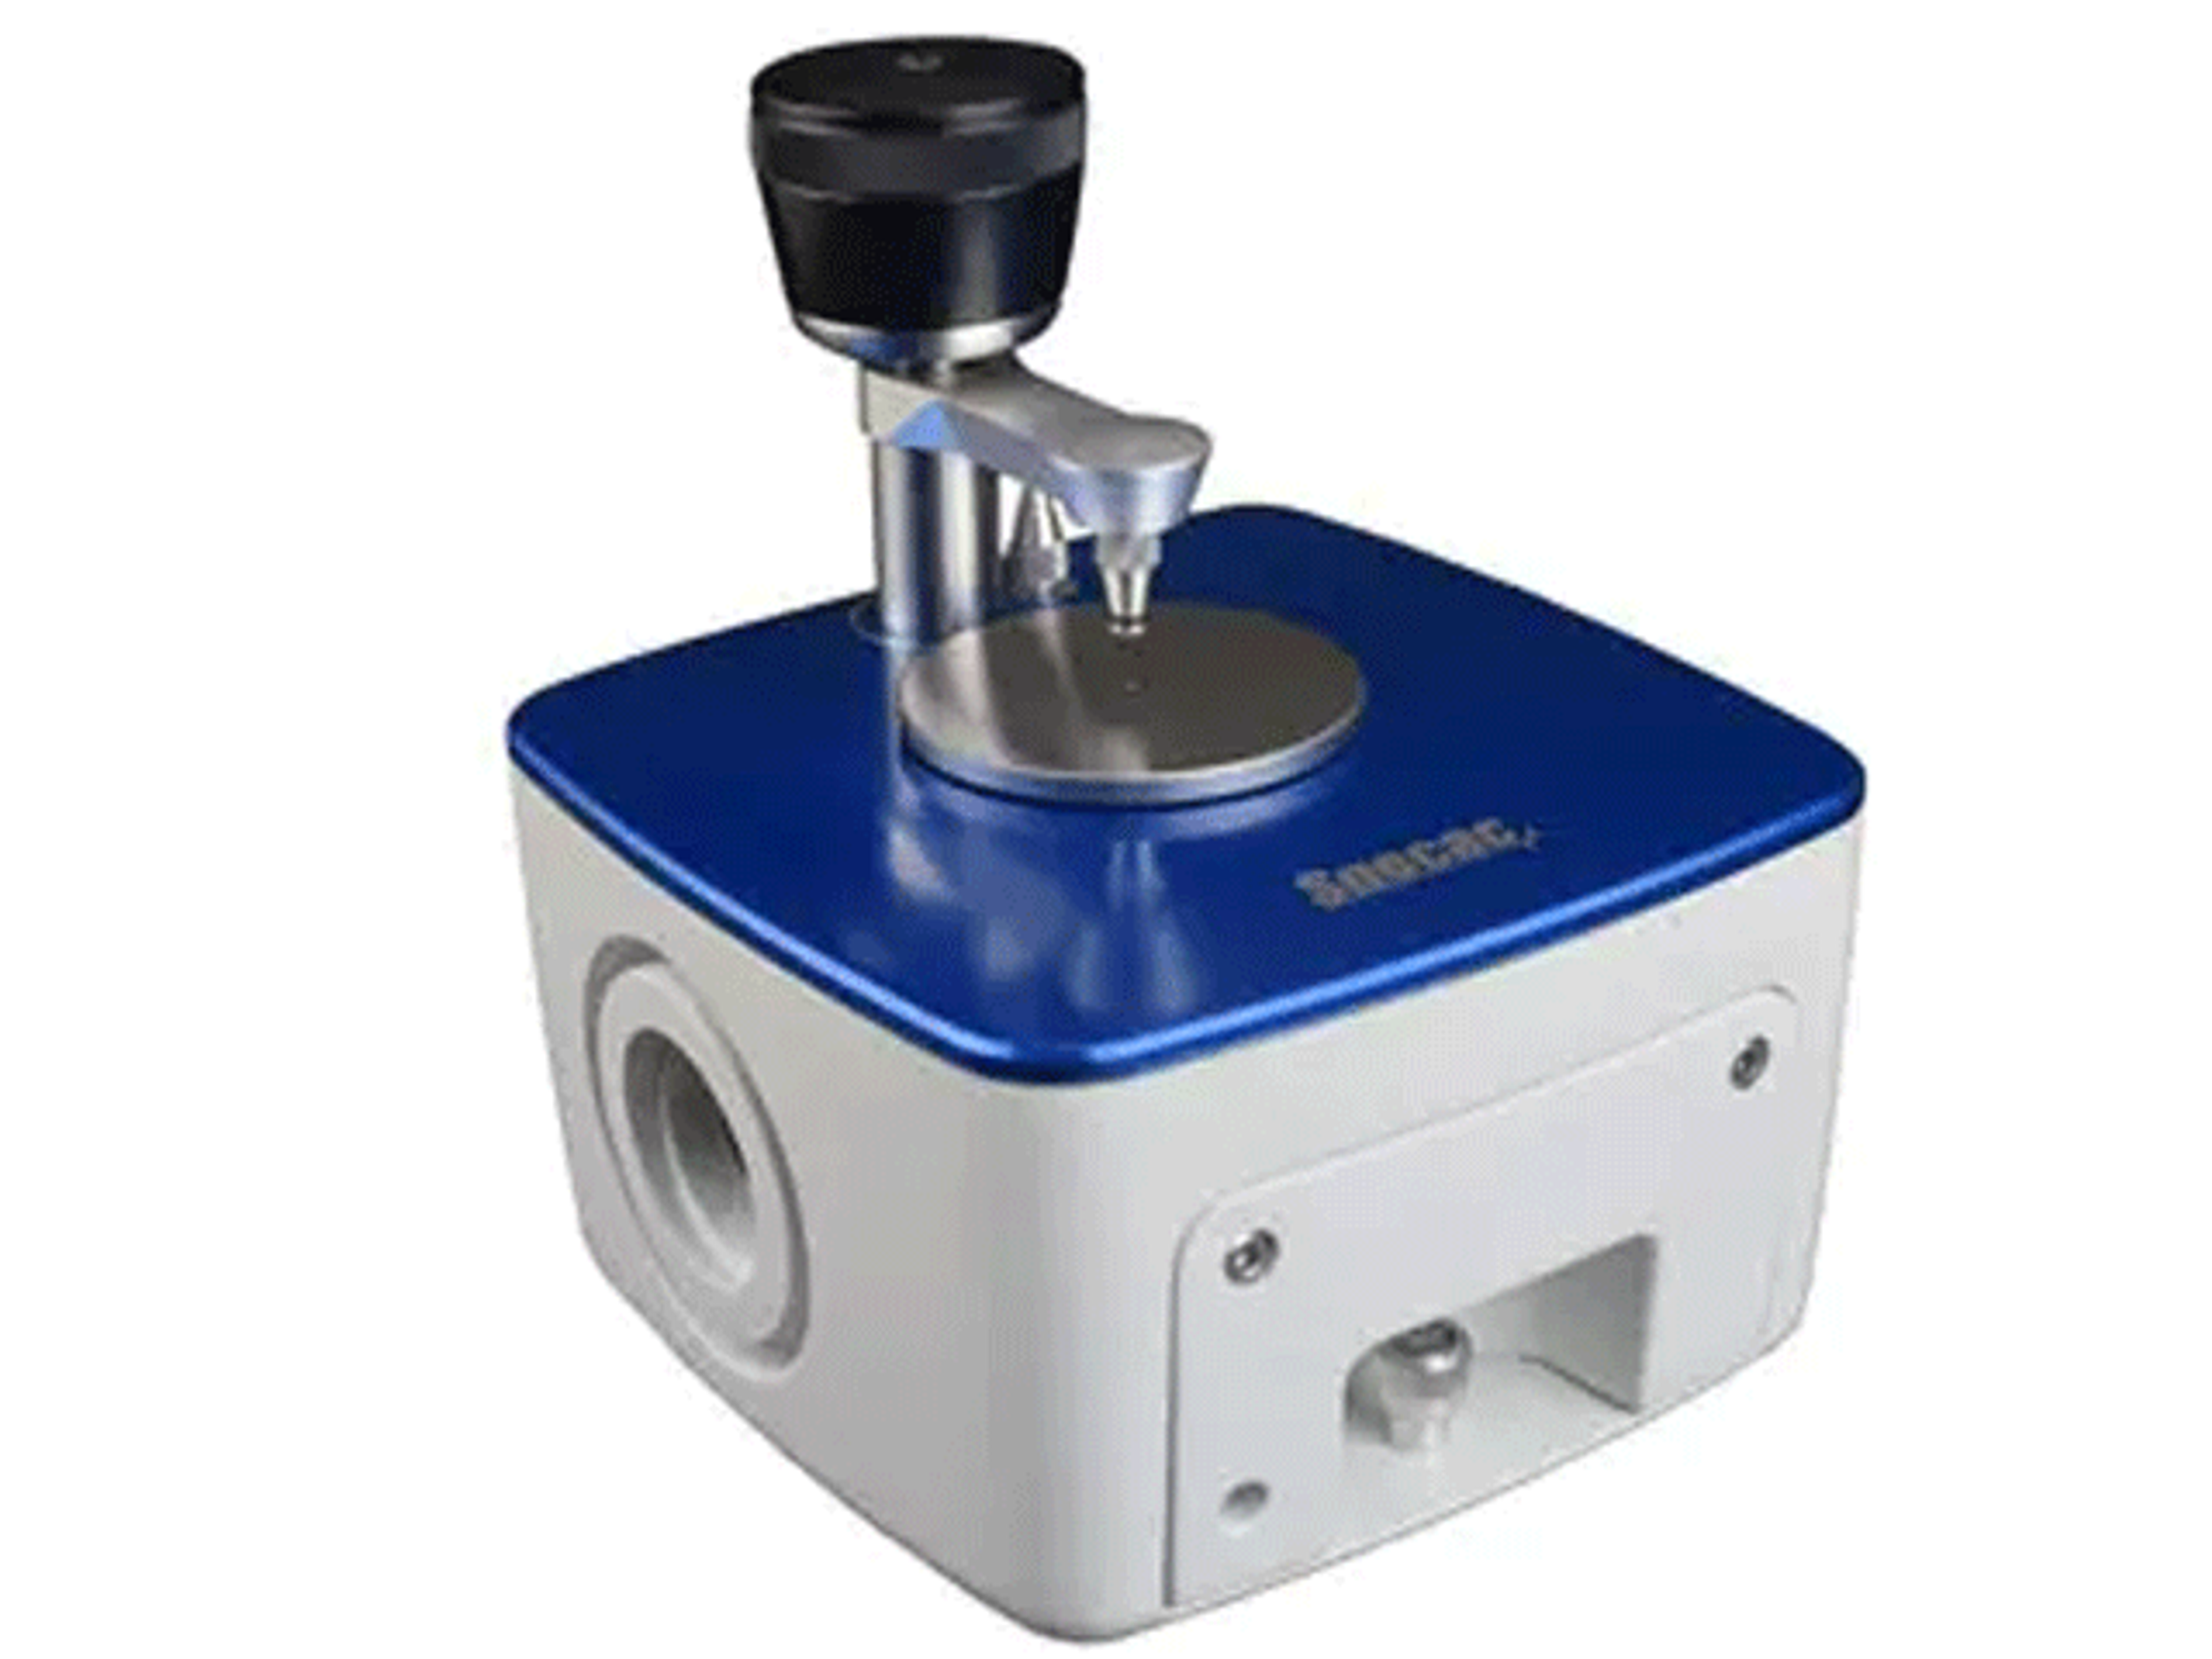
On-Site Analysis of Cannabis Potency Using Infrared Spectroscopy
26 Apr 2017
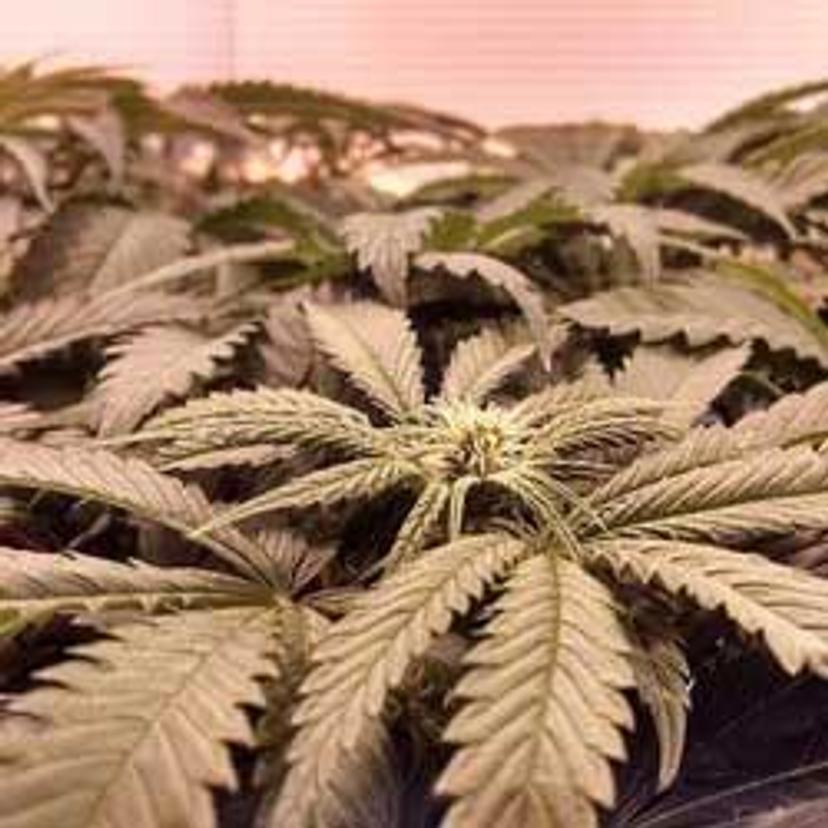
Cannabis Plant
Source: www.specac.com
Cannabis is increasingly being recognised as a substance with therapeutic/medicinal value. This has led to a reduction in its regulation, and even its legalisation, by many different governments. As cannabis production becomes legalised and regulated it is important that manufacturers can assess the chemical content and potency of their plants.
The value of cannabis in the control of pain, spasm, and a range of other diseases (e.g., bipolar disorder and certain cancers) is becoming established across the medical world US [2]. Medicinal cannabis is now legal, or in the process of being legalized, across 25 states in the US [2], and also across countries from Canada, to the Netherlands and Italy.
While the use of raw cannabis is still not approved by the FDA (in the USA) there are now pill forms of cannabinoids [1] that can be used in the treatment of some medical conditions.
In the UK, the ‘End Our Pain campaign’ supports the legalisation of medical cannabis and estimates that one million people across the UK rely on cannabis for medical reasonse [3]. A seven-month inquiry from the All Party Parliamentary Group (APPG) for Drug Policy Reform took evidence from 623 patients, professionals, and experts and more than 20,000 scientific and medical reports and recently concluded that cannabis has medicinal value and could be legalised [3].
The Cannabis (Legalisation and Regulation) Bill 2015-16 in the UK received its first reading in March 2016 and it remains to be seen if this will eventually become law and allow the medical use of cannabis in the UK [4].
The Active Ingredients in Cannabis
Tetrahydrocannabinol (THC), is the main psychoactive cannabinoid in cannabis. When THC enters the body, it interacts with cannabinoid receptors in the central nervous system and in the immune system [6,7]. Aside from its well-known psychoactive effects, getting ‘stoned’, THC is imbued with a number of other valuable effects. THC has been demonstrated to increase appetite and to reduce nausea, pain, inflammation (swelling and redness), and muscle spasms.
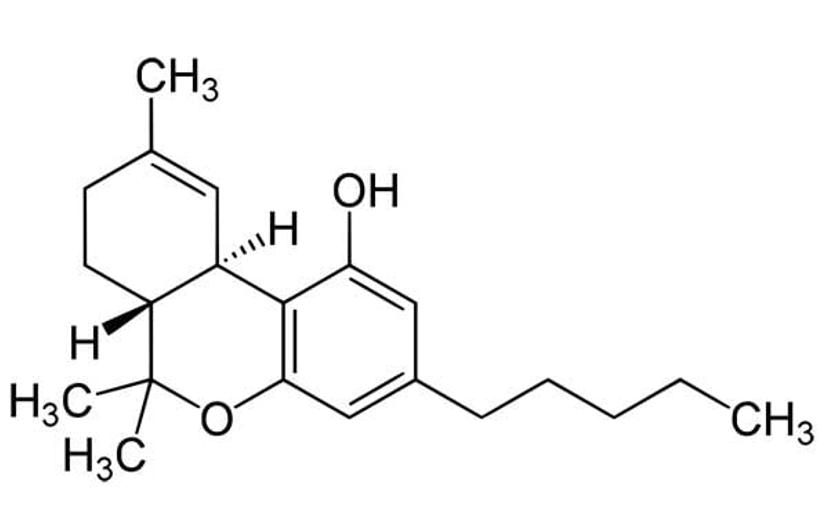
The molecule Tetrahydrocannabinol (THC)
The other major cannabinoid in cannabis, cannabidiol (CBD), also has therapeutic value and has been shown to reduce pain and inflammation, help control epileptic seizures, and has shown promise in treating mental illnesses [8].
THC and CBD have been used in the treatment of a range of different, unrelated, conditions (e.g., diabetes, glaucoma, bipolar disorder, multiple sclerosis) but they are mostly used in the treatment of chronic pain [9].
Growing Cannabis
When cultivating cannabis, the important factors that indicates the crops value are the levels of THCA and CBDA (which are acidic forms of THC and CBD). The levels of THCA and CBDA can vary between 5% and 30% according to the species of the plant crop [5]. The majority of the cannabinoids (including THCA and CBDA) accumulate in the plants flowers, which are then harvested.
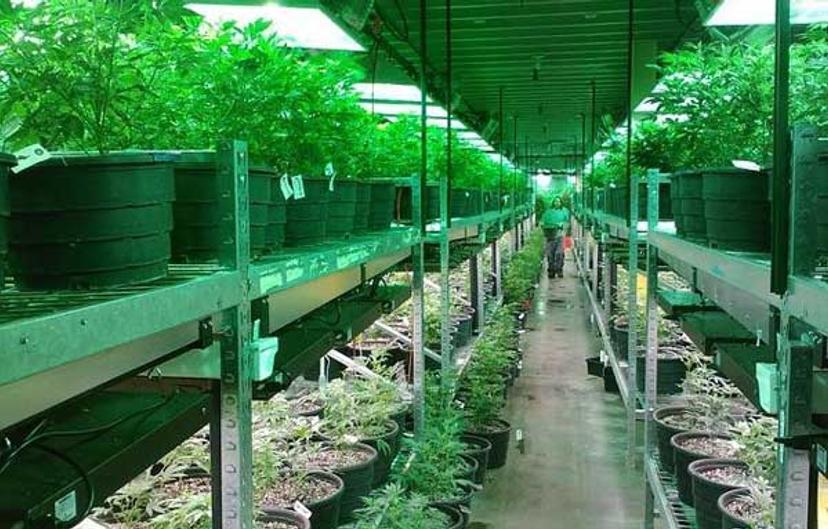
A cannabis grow operation
Cannabis plants are constantly being developed and selectively cross-bred in order to improve the yield of THCA and CBDA, and to also increase the range of other cannabinoids present, in the plants flowers. This has led to the need for a convenient and rapid analytical method to provide quantitative data on the cannabinoid content of different strains.
The difficulty of analysis lies in accuracy and throughput; there is such a volume of material that traditional gas chromatography is not feasible.
Although gas chromatography coupled with mass spectrometry (GC-MS) or nuclear magnetic resonance (NMR) would be the most accurate methods, the equipment for either technique is expensive and requires a skilled operator to be used successfully. Alternatively, growers could send samples to a GC-MS analysis lab but this is also expensive and there is a delay due to the time between collecting the sample and receiving the results.
Spectroscopy is becoming a method of choice for cannabis growers as the use of spectroscopic methods is between 5 and 10 times faster than GC-MS and can be undertaken by a relatively unskilled operator.
Near infrared spectroscopy (NIR) is a favourable method for cannabis analysis as NIR has already been successfully applied to analyse the ‘bulk’ of other agricultural products. NIR has the advantage of providing a much lower cost per analysis than GC-MS, has excellent accuracy, uses no solvents to extract samples (THC and CBD are not water soluble) and is rapid and economical – especially when taking multiple measurements of heterogeneous samples [6,7].
Using FT-IR to Determine the THC and CBD Content of Cannabis
Cannabis producers are particularly interested in maximising the THC and CBD content (potency) of their plants by selective breeding plants by optimising their growing conditions (i.e., light, soil, and water). As producers seek to optimise growing conditions, the monitoring of plants during growth is becoming commonplace. FT-IR is rapidly become the method of choice as it can provide instant results.
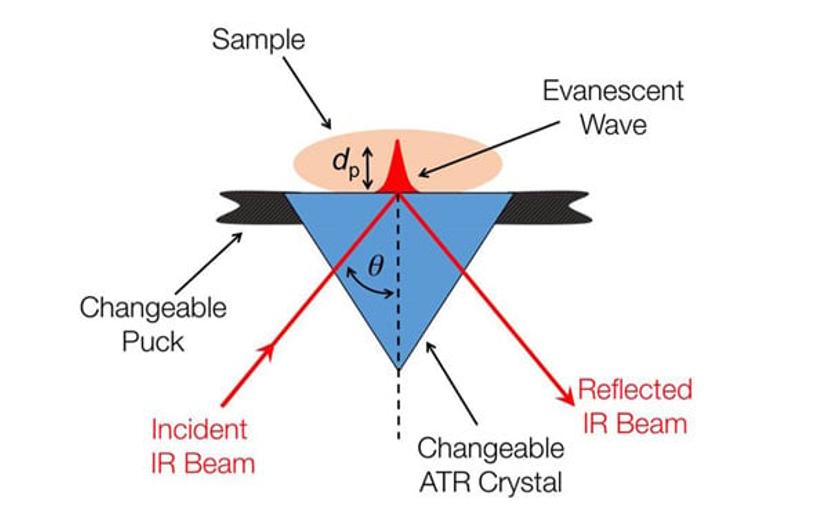
How ATR FT-IR spectroscopy works
FT-IR can be used to monitor how plant potency changes over time, as the plant grows, and how any changes in the external environment have effected THC and CBD production.
FT-IR analysis of cannabis, due to the wide range of cannabinoids present, could be problematic because peaks resulting from THC could be masked by other compounds [7]. However, chemometric methods can be easily employed which statistically separates overlapping peaks. This allows the rapid and accurate, on-site determination of THCA and CBDA in cannabis flowers.
Both GC-MS and NMR require sampling, sample preparation and a specialist analytical lab, which causes delays and is more expensive. FT-IR monitoring can be carried out continuously during plant growth, allowing conditions to be changed quickly to maximize the THC and CBD yield. FT-IR is an inexpensive and accurate method that provides an excellent method for monitoring THC and CBD levels in real-time [6,7].
Specac’s FT-IR Accessories for Cannabis Analysis
Specac provide a range of ATR accessories that can be used with a wide range of spectrometers in the analysis of solid samples such as cannabis flowers. Specac’s QUEST ATR is ideal for cannabis analysis as:
- The diamond ATR puck allows a wide range of sample shapes and forms which is useful when dealing with dried flowers.
- Little or no sample preparation is required, meaning no chemicals are required and the sample is not destroyed.
- The diamond top plate allows the widest range of IR spectrum to be obtained 400-4000cm-1 meaning a wide range of cannabinoids can be detected.
Specac also provide an autotouch press which can be used in compress cannabis samples into pellets for analysis. Whilst this is not essential for experiments using the QUEST (which can deal with samples of various shapes and sizes) it can be helpful for further chemical analysis integrated with IR.
The ATR accessories provided by Specac such as Quest provide the means to make the continuous and consistent FT-IR analysis of cannabis a viable and inexpensive option for cannabis cultivators.
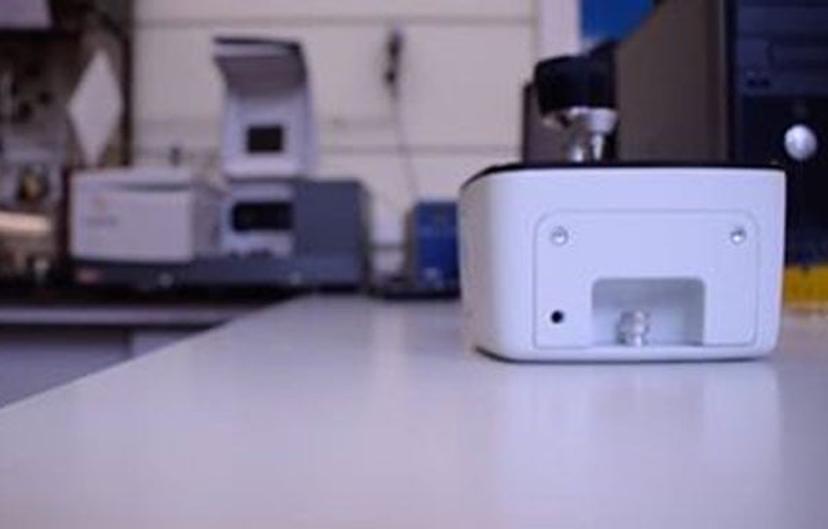
The Specac Quest ATR accessory
References
1. https://www.drugabuse.gov/publications/drugfacts/marijuana-medicine Accessed October 27th 2016
2. 25 Legal Medical Marijuana States and DC – Medical Marijuana – ProCon.org". procon.org. Retrieved 27th October 2016
3. http://www.bbc.co.uk/news/uk-37318935 Accessed October 27th 2016
4. http://services.parliament.uk/bills/2015-16/cannabislegalisationandregulation.html Accessed October 27th 2016
5. Todd Mikuriya, Introduction from Marijuana: Medical Papers, Medi-Comp Press, 1973, pp. xiii-xxvii
6. Brian C. Smith, Fundamentals of Fourier Transform Infrared Spectroscopy, CRC Press, Boca Raton, 2011.
7. M. Giese, M. Lewis, L. Giese, K. Smith, Development and Validation of a Reliable and Robust Method for the Analysis of Cannabinoids and Terpenes in Cannabis.” Journal of AOAC International 98(6):1503-1522, 2015
8. R.G. Pertwee, The pharmacology of cannabinoid receptors and their ligands: An overview, International Journal of Obesity. 30: S13–S18, 2006
NIDA Research Report series: Marijuana, https://www.drugabuse.gov/sites/default/files/mjrrs_3.pdf, Accessed October 27th 2016

