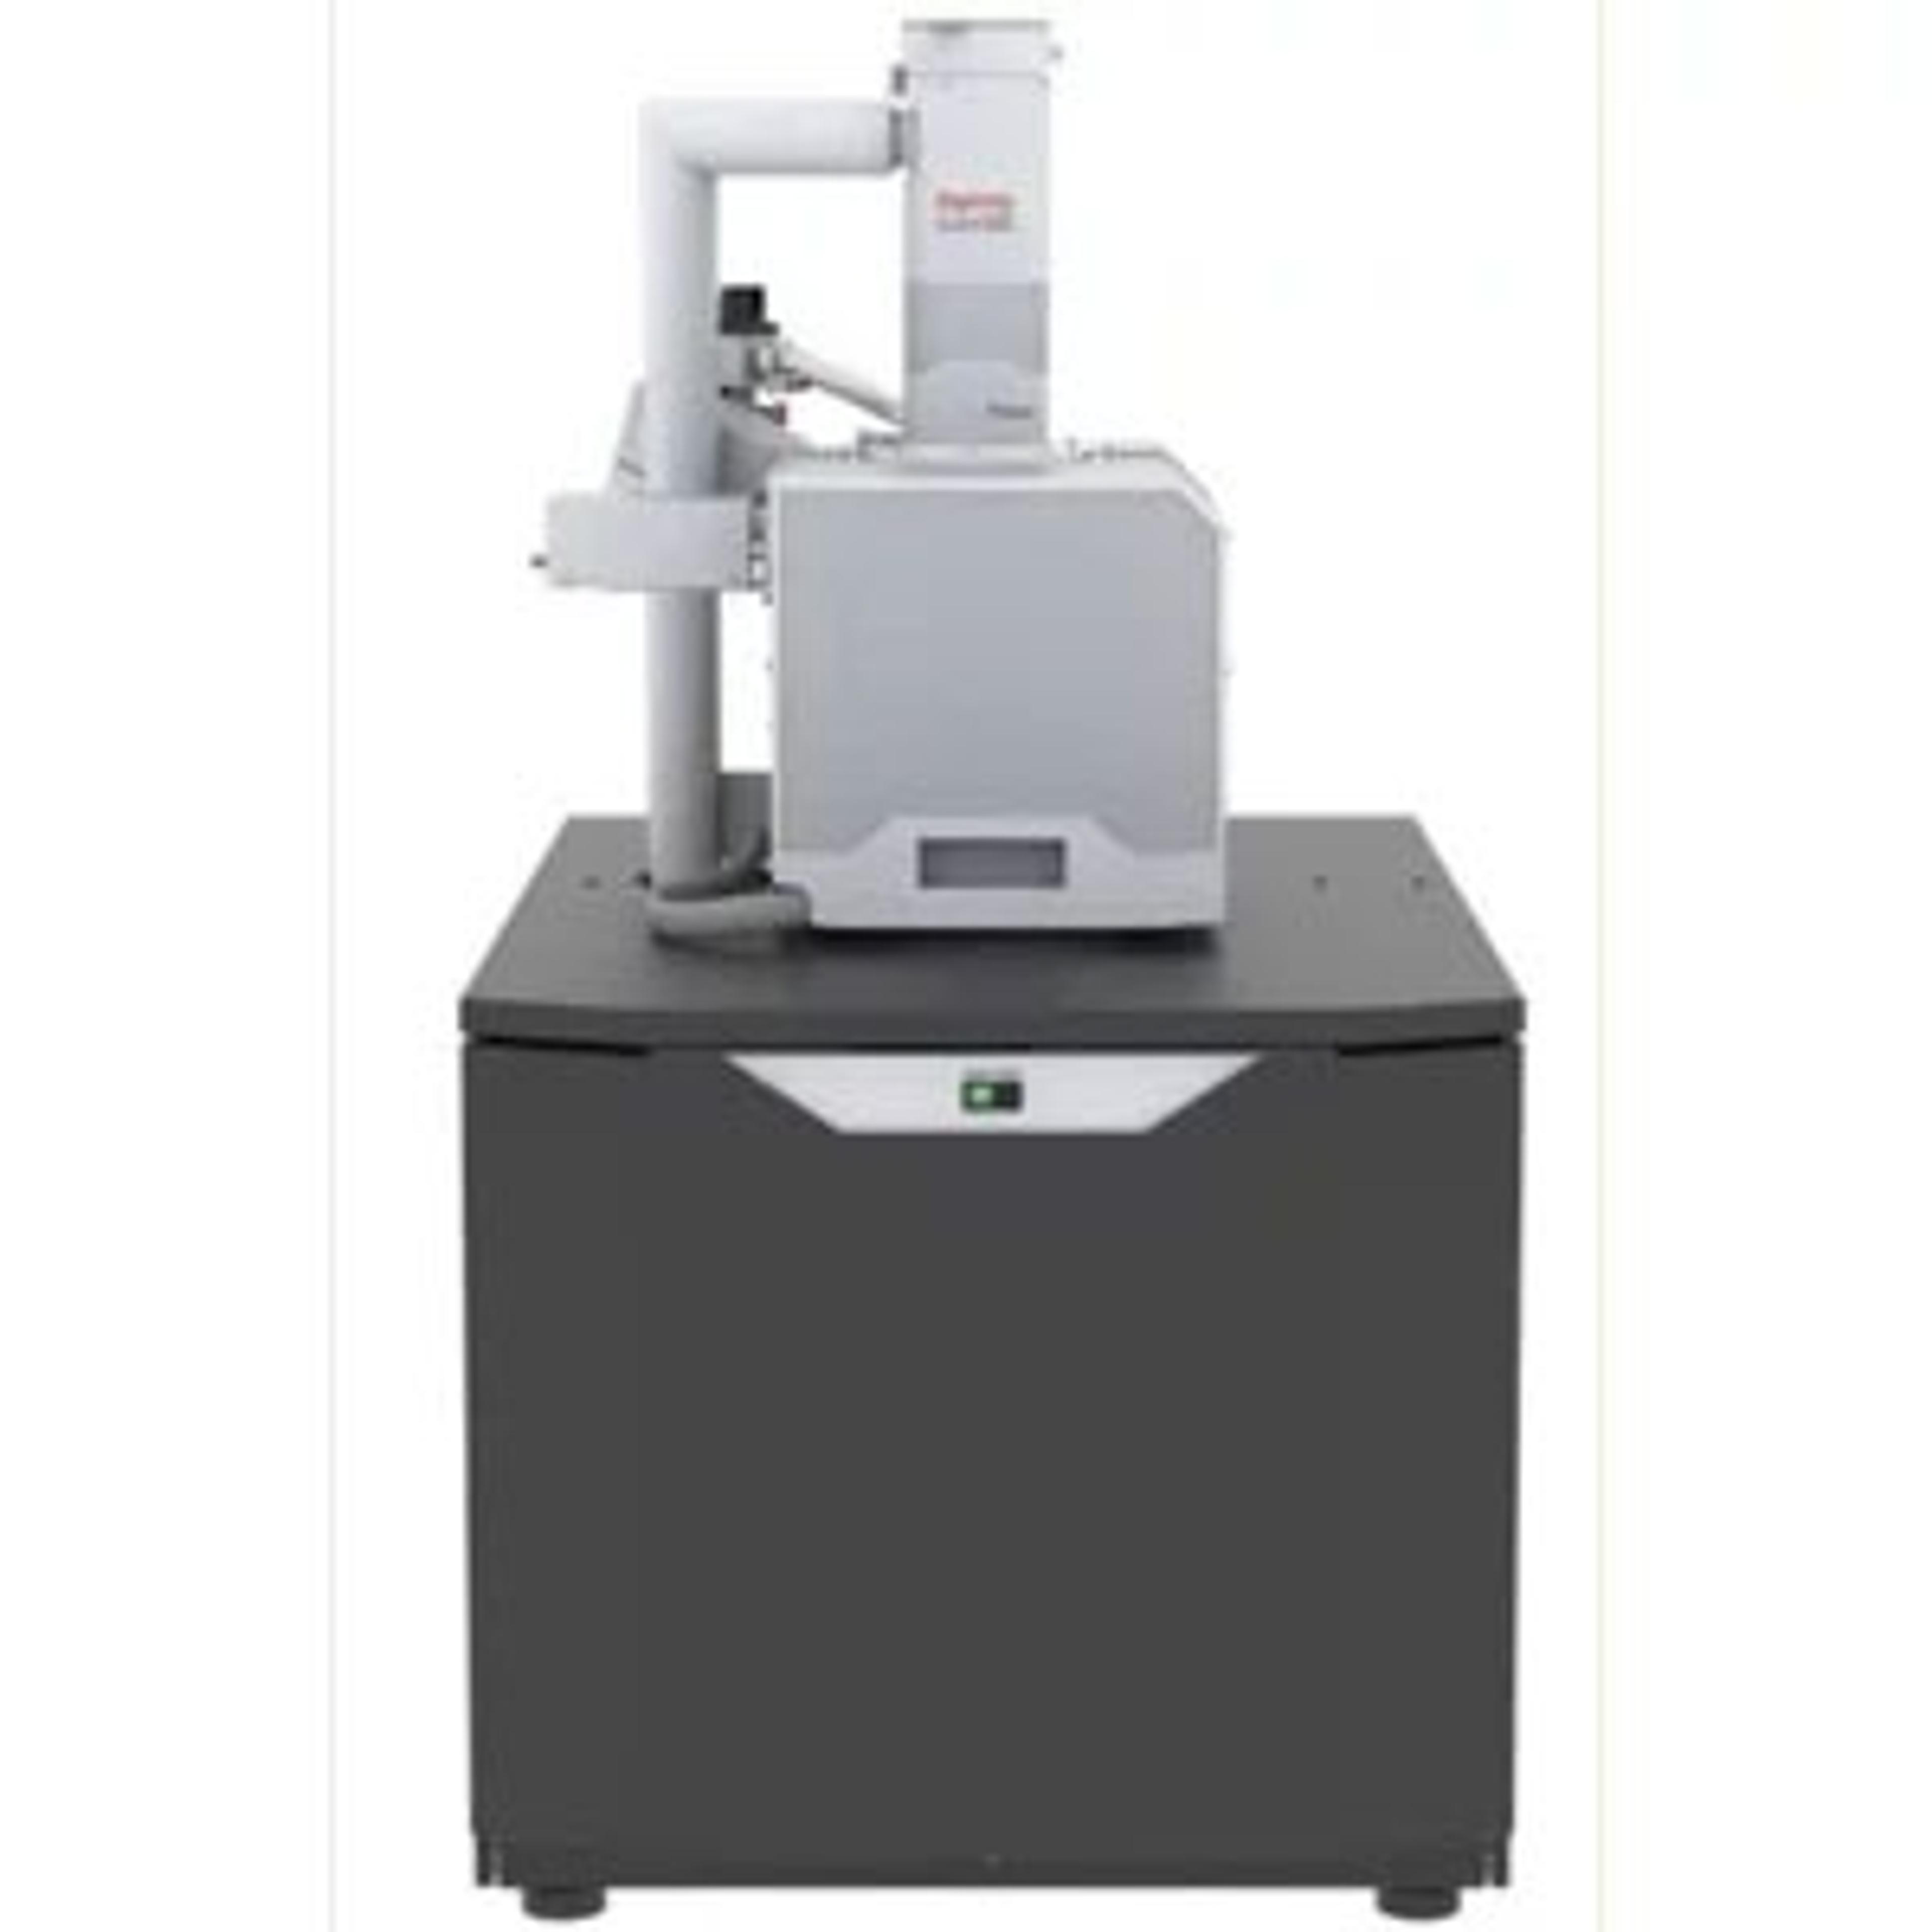
SEM: Explore the microscopic world in color
Just as color transformed black and white movies, so ColorSEM Technology has smashed the boundaries of microscopy, allowing researchers to visualize hidden wonders in color
10 Aug 2020
Technological advancements in scanning electron microscopy (SEM) have transformed how researchers study features and phenomena too small to see with other techniques. Now boundaries are being pushed even further by adding more than just a touch of color to the traditionally black and white world of electron microscopy, enabling scientists to generate instantaneous compositional information in the form of high fidelity live color images, making the typically painstaking task of integrating SEM images with energy dispersive X-ray spectroscopy (EDS) observations as easy as clicking a single button. In this article, guest editors Eric Goergen, Ernst Jan R. Vesseur and Alex Ilitchev, from Thermo Fisher Scientific, along with Dennis Manuel of Houston Electron Microscopy, explore this revolution in SEM imaging and share a series of illuminating application case studies.
Back to basics
When color was first introduced in motion pictures, it transformed greyscale film into vibrant depictions of the world as it existed in real life. This process was, however, labor intensive, and involved manual tinting or even hand painting of film. It was only when color information could be collected during the recording process that color became the standard for movie production.
Now, thanks to new EDS technology available with scanning electron microscope (SEM) imaging and analysis, today’s researchers are experiencing a similar revolution. Scientists are now able to probe samples with a focused electron beam to generate remarkably high-resolution images to reveal compositional relationships to microstructure, such as the surface topography, cell structures, composite materials and nanoparticles easier than ever before. Over the years, the chemical composition of a sample has proven to be indispensable in a wide range of applications, including the identification of mechanical/material failures, the pinpointing of product defects, and the detection of food contaminants. To have both contextual and compositional information, SEM imaging is combined with EDS analysis; however, some argue this process is cumbersome, necessitating navigating multiple software packages and manual correlation of data, both of which make SEM-EDS more complicated than this invaluable technique should be.
From greyscale to color
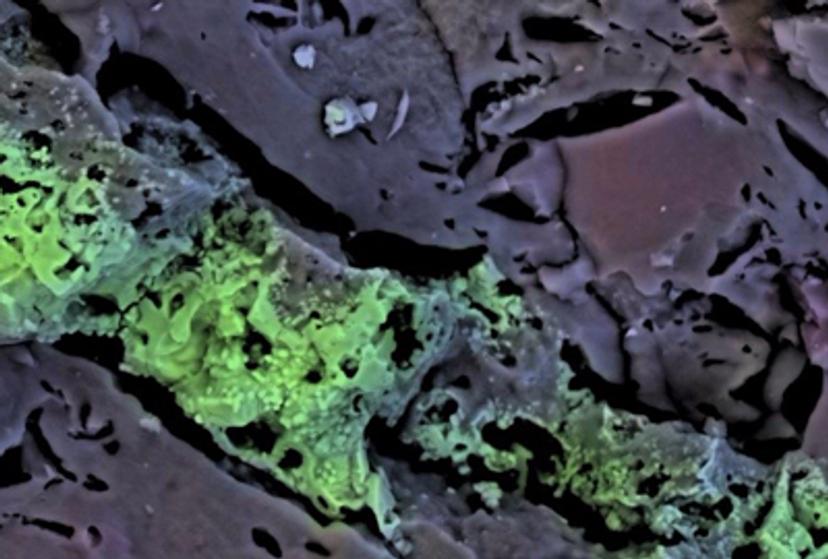
SEM provides researchers with a greyscale image, showing microstructural and topographical contrast based on backscattered and secondary electrons. EDS analysis, meanwhile, obtains compositional information, as the sample’s atoms emit characteristic X-rays when impacted by the electron beam of the microscope. The SEM image is subsequently colored according to the detected EDS spectrum at each point in the scan of the sample. The challenge is that EDS analysis can often be difficult for new users to learn. Additionally, combining SEM and EDS requires scientists to engage in the time-consuming task of switching back and forth between the two techniques using separate computers, software, and user interfaces often sold and maintained by different vendors.
With advanced EDS acquisition and rendering technology built directly into SEM imaging and analysis, these two techniques have now been combined into a single tool. The first commercial solution that includes integrated elemental analysis blended with electron image capture, Thermo Scientific ColorSEM Technology offers materials scientists the detailed information they need to advance their research, without having to master EDS analysis. Their once greyscale images can now be seen in color almost instantly as the sample is scanned by the SEM. This, in turn, promises to advance materials science by allowing researchers to identify the chemical composition of samples quickly and accurately at the microscale.
A single tool for SEM and EDS analysis
With ColorSEM Technology, EDS information is available with the push of a button. The elements present are identified and separated out into different colors within the image, showing researchers not only their precise location but also relative proportion and concentration. As with conventional EDS analysis, users can generate an X-ray spectrum from the entire scan area of the SEM image. They can also obtain localized elemental information by investigating a specific spot or series of spots or following a linear trace on the sample.
Consider a sample of copper-nickel-zinc, which are neighboring elements on the periodic table. In a regular SEM backscattered image, all three elements appear roughly the same grey color, making each element difficult to distinguish. With EDS technology built directly into the SEM software user interface, researchers can now immediately see a color image that precisely distinguishes the nickel from the copper and zinc, saving a tremendous amount of time and effort. ColorSEM, therefore, is more than integrated EDS, it has turned EDS into a detector that can be used to aid in navigation and identifying areas of interest that may have been passed over or more difficult to find without the addition of compositional imagery.
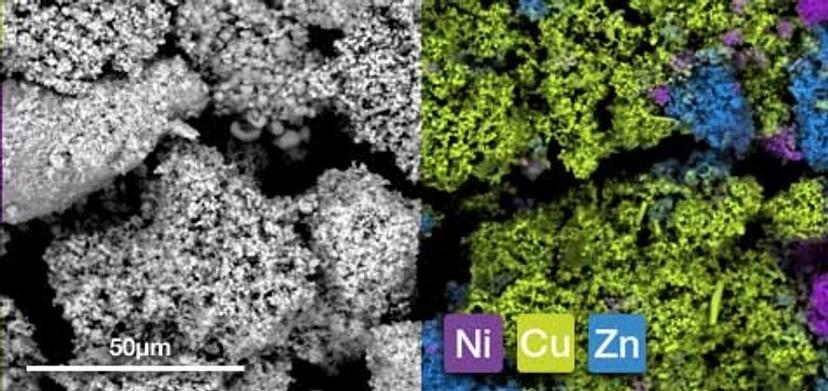
With next-generation color technology, obtaining an EDS color image is at least four times faster than traditional EDS analysis—reducing the time-to-image from minutes to seconds. Thanks to advanced algorithms that have been refined over time, the color information provided is highly accurate and reliable.
ColorSEM Technology is “always on,” meaning that EDS data is collected every time a sample is scanned, and the information is readily available when the researcher needs it. This advanced technology increases user productivity, allowing multi-user labs to expand the number of researchers that can use their facilities. The data is easy to access and manipulate with little to no training, which also extends EDS analysis to a larger number of users. This means, no more switching between UIs and losing valuable time and concentration. With ColorSEM technology, the user is 100% focused on the sample and the tools needed for additional information are all in reach.
Case studies: Applications of ColorSEM technology in metallurgy and metal analysis
1. Sensitization of steel
Welded components are inherently susceptible to corrosion due to the heterogeneous chemical composition of the weld. In order to understand the nature of failures that occur at weld lines, a microstructural analysis is often necessary.
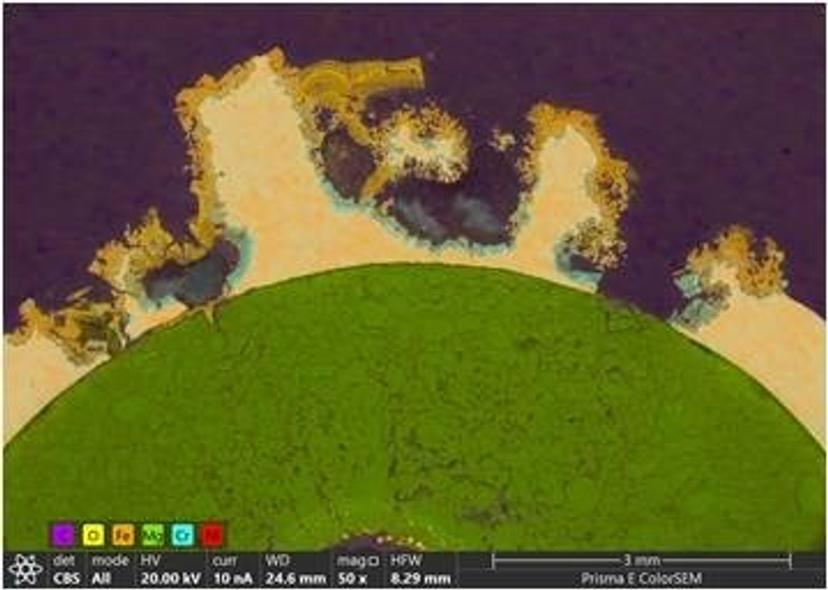
In this example, a cross-section of an industrial submersible heater is shown. These devices are composed of a wire (the heating element) wrapped in a magnesium oxide insulator and a surrounding shell of stainless steel. The wire can precisely heat the stainless-steel exterior to produce granular control of the surrounding liquid’s temperature. Here, the heater was found to exhibit longitudinal corrosion along the weld.
While it may be possible to locate the fault using SEM, this method alone would not provide the required material contrast to reveal the cause of the failure. The addition of EDS analysis not only grants immediately distinct differentiation between the insulator and the stainless steel, but also shows extensive oxidation within the weld without the presence of chlorides, which would be typical of water-induced corrosion. This is also coupled with a visible accumulation of chromium along the fault.
While the exact cause of the oxidation remains unknown, the localized accumulation of chromium points toward sensitization of the metal along the weld. This is the result of chromium carbide formation from the high temperatures of the welding system; the carbides deplete chromium from the matrix, thereby making the material more susceptible to corrosion and oxidation.
This microstructural analysis is only possible through the combined application of SEM and EDS, which reveal the spatial micro-scale distribution of elements within the sample.
2. Dezincification of brass
Brass is widely used in the manufacturing of heat exchangers due to its thermal conductivity and high resistance to corrosion. Nevertheless, brass can become susceptible to dezincification and corrosion if zinc content is above 15% and the alloy is not otherwise treated. As zinc is far more reactive than copper, it will selectively leach from the alloy in the presence of stagnant or mineral-rich water, leaving brittle, copper-rich areas with little mechanical strength.
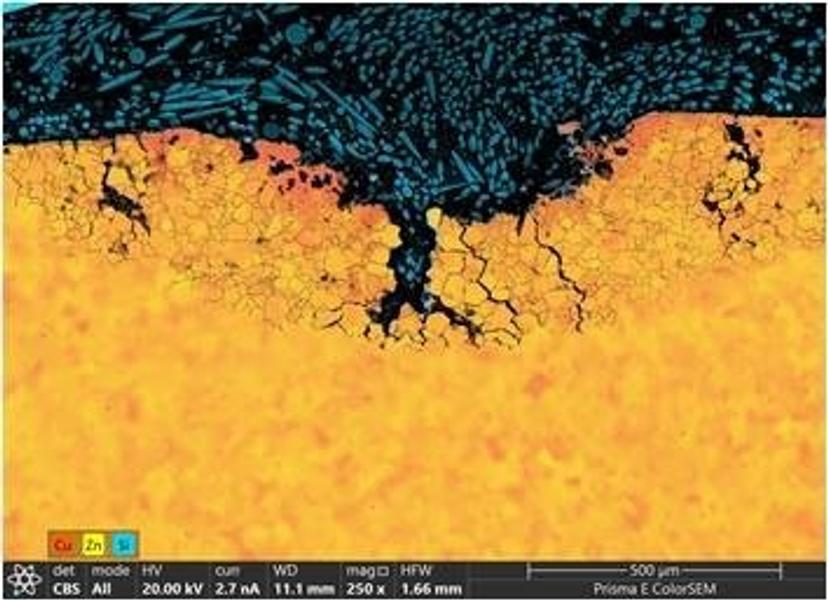
Here, a cross-section of a brass heat exchanger tube is shown with extensive dezincification and intergranular corrosion. While the mechanical damage can be highlighted with SEM, the addition of EDS clearly reveals the buildup of copper at the surface of the fault. This once again highlights the value of combining EDS and SEM to provide both microstructural as well as chemical insight for fault and failure analysis.
3. Thermal spray coating
Flame or thermal spray is a coating method that uses a high-temperature flame to apply semi-molten feedstock material, typically metal powders, onto a surface. The applied coating provides increased protection against wear, corrosion, etc. and can be composed of a variety of feed materials. Cross-section analysis of these coatings provides information on their homogeneity and durability.
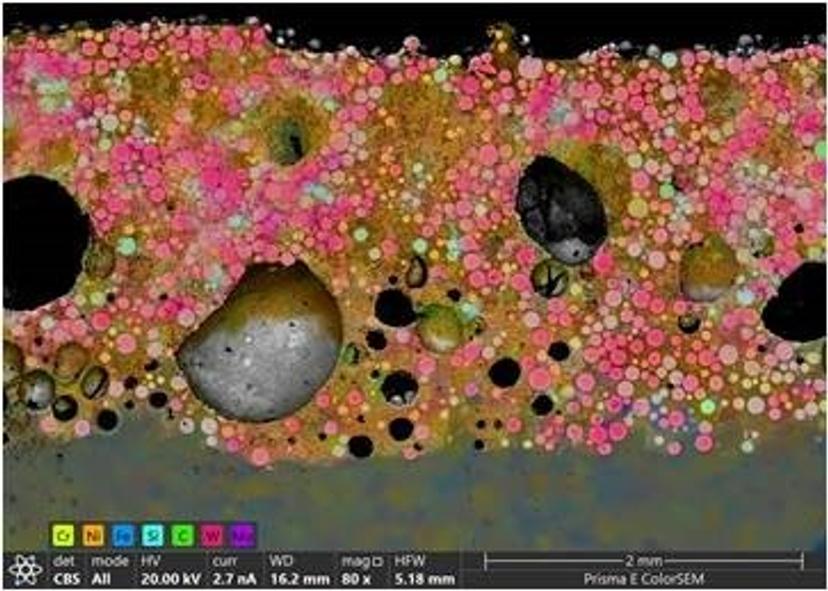
In this example, carbon steel is coated in a layer of tungsten carbide, applied in a matrix of nickel. SEM analysis reveals both the presence of feedstock particles as well as the porosity of the layer. The addition of EDS analysis adds unambiguous identification of the observed particles, as well as their heterogeneous distribution within the coating. This information can be used to modify coating parameters in order to produce more uniform, durable layers.
A new era of compositional analysis
The integration of EDS and SEM analysis has implications for a broad range of research areas from geoscience to battery research to the development of more durable construction materials.
A U.S.-based commercial analytical laboratory is using ColorSEM Technology to help petrochemical customers rapidly discern the types of clays in geological core samples. Clays have certain morphology characteristics that can be hard to see in greyscale SEM images, so the lab combines SEM and EDS for compositional analyses. Using ColorSEM Technology, researchers found they can generate EDS color images up to 10 times faster than with conventional EDS analysis.
Likewise, an oil and gas research organization is using ColorSEM Technology to immediately analyze samples that have different morphologies and compositions.
With the ability to instantly view and analyze EDS information directly from an SEM, scientists are obtaining meaningful elemental content far easier and faster than was previously possible. This technology promises to usher in a new era of compositional imaging as a basis for materials discovery, not an additional technology that is a separate process to sample analysis.

