New prognostic test for colorectal cancer details spatial interaction between tumor and immune cells
Multiplexed immunofluorescence and next-generation image analysis offer spatial insights into the tumor microenvironment
14 Nov 2019
Despite the current treatments for colorectal cancer, about 20% of stage II patients experience recurrence and disease-specific death. Now a new prognostic index developed by scientists at the University of St. Andrews in Scotland promises better identification of high-risk stage II colorectal cancer patients compared to traditional methods of cancer staging.
In this interview, we speak with Senior Research Fellow Dr. Peter Caie and Ph.D. student Ines Nearchou, from the University of St. Andrews, about these fascinating new findings that appeared in Cancer Immunology Research earlier this year.
The traditional histological method for staging colorectal cancer is tumor-node-metastasis (TNM), which, as the names implies, is calculated from tumor size and extent, lymph node involvement and distant metastasis. While accurate at a population level, TNM staging is less prognostic at a personal level as patients with the same stage can experience distinct survival outcomes. Quantification of two additional features, tumor buds and lymphocytic infiltration, can add prognostic accuracy to TNM staging. While increased tumor buds – small isolated cancer cell clusters that have broken away from the main tumor mass – correlate with poor survival, increased lymphocytic infiltration correlates with improved survival outcome.
While the prognostic value of tumor budding and lymphocytic infiltration have been shown in isolation for colorectal cancer, the Caie lab adopted a unique combinatorial approach to study the relationship between them. “We are trying to see how these two different features of the tumor microenvironment interact with each other,” says Nearchou. “It's their spatial relationship that we're really interested in,” adds Caie.

The Caie lab analyzed cancer tissue sections from 114 patients with stage II colorectal cancer who underwent surgical resection and employed multiplexed immunofluorescence, whole slide tissue imaging and image analysis to study the spatial relationship between lymphocytes and tumor buds in situ. “We are capturing how these cells interact with each other, which wouldn't be possible if it was to be done with other techniques,” says Nearchou.
“A lot of proteomic and multi-omic techniques result in the destruction of the tissue architecture. The spatial relationships between cells in the tumor microenvironment would be lost if we disrupt that tissue architecture, so we have opted to use image-based techniques,” Caie explains.
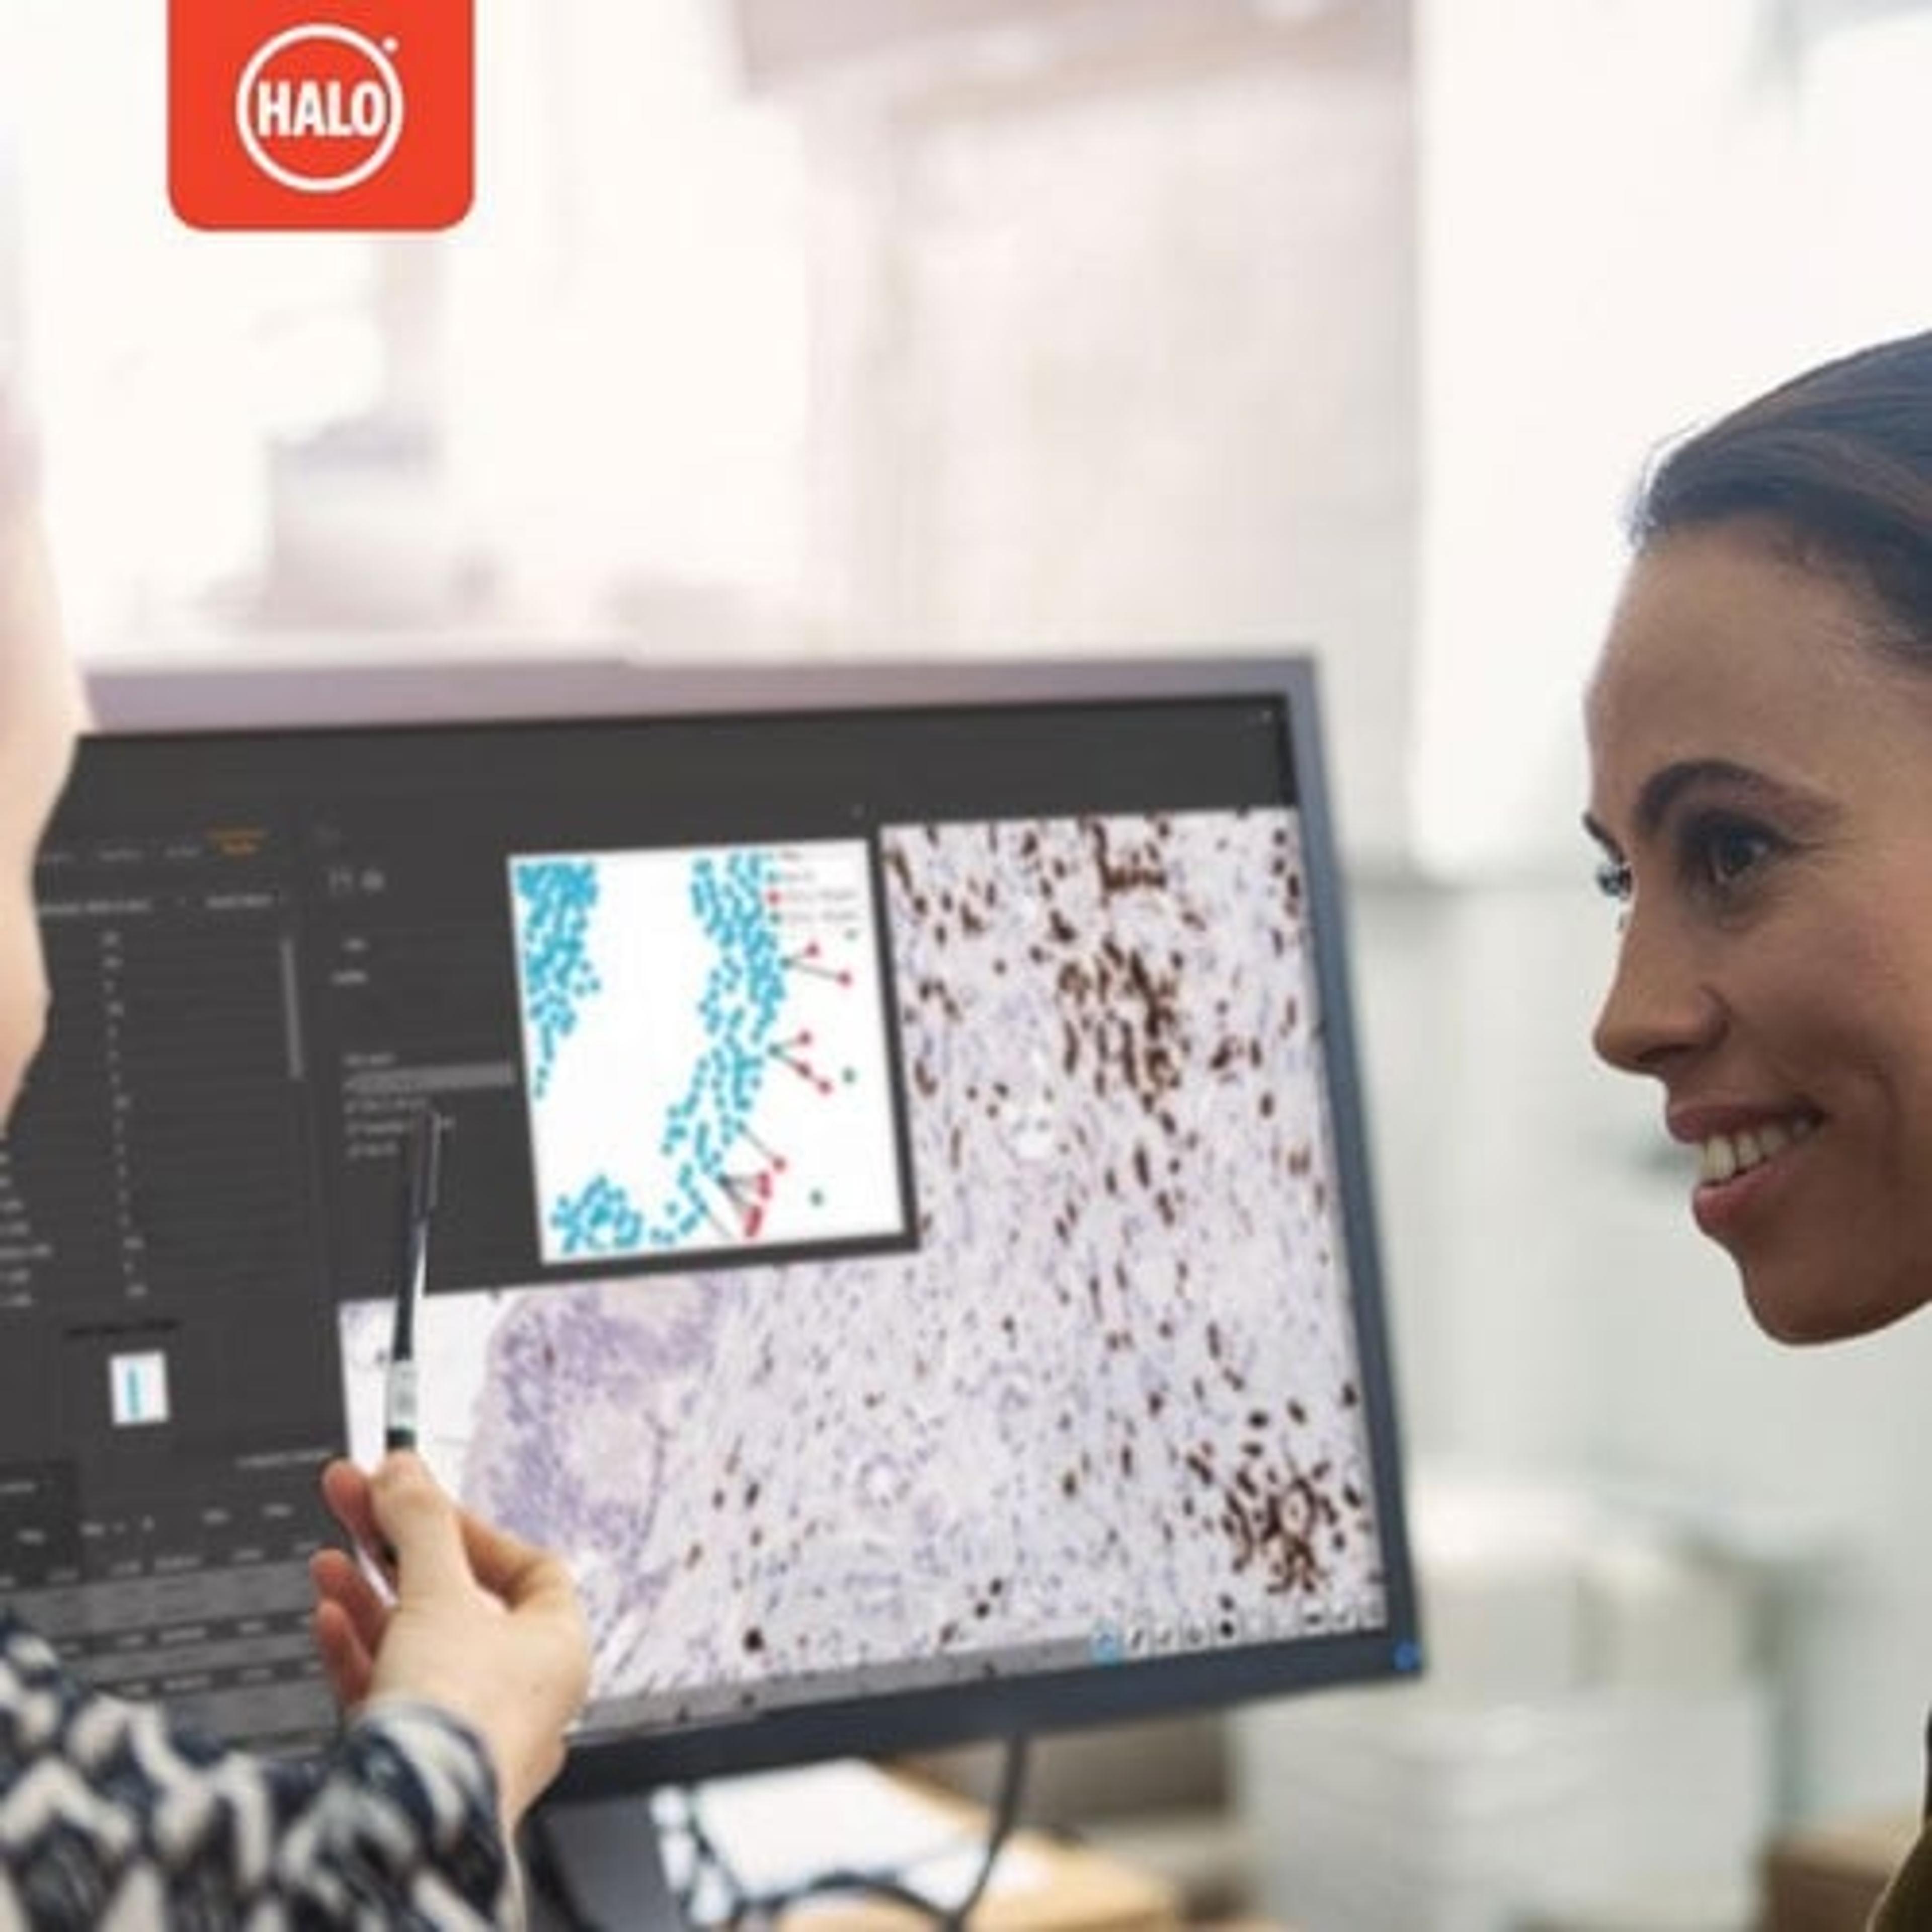
Multiplexed immunofluorescence used for whole slide analysis offers advantages over H&E or immunohistochemistry (IHC) in obtaining spatial information. Caie continues: “We can identify specific cells based on multiple biomarkers, including tumor cells and different immune cell phenotypes, and can visualize their interactions down to the single-cell resolution.”
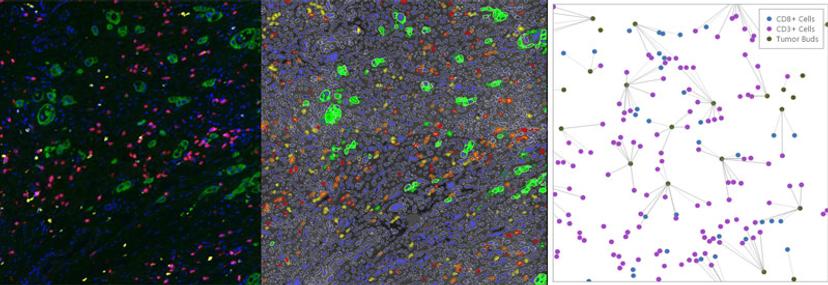
The digital whole slide fluorescence images are then uploaded to the Indica Labs' HALO® image analysis platform to identify every lymphocyte and tumor bud in the section and to pinpoint their exact X-Y locations. Nearchou explains HALO spatial analysis in further detail: “Once we've identified the features of interest, i.e., the CD3+, CD8+ lymphocytes and the tumor buds, we can plot them spatially in HALO. From here, we can automatically quantify the lymphocytes that are at different distances from the tumor buds.” Lymphocytes within close proximity of tumor buds are more likely to be interacting with these cells and targeting their destruction.
This automated analysis enables a level of quantification beyond what can be offered using traditional pathology methods. “Realistically, this is not something that would be feasible to quantify by eye as it would be impossible to identify each and every single cell, and then to count all the lymphocytes and tumor buds as well as measure their exact distances from each other,” notes Nearchou.
To stratify patients into low and high risk of disease-specific survival, the team went on to establish the Tumor Bud-Immuno Spatial Index (TBISI), using data from lymphocytic infiltration, tumor buds and their spatial relationship. In the training cohort, TBISI significantly improved stratification of high-risk patients compared to TNM staging, tumor budding or lymphocytic infiltration alone.
The team went on to validate the TBISI method on two separate cohorts from Scotland and Japan. “It's crucial to test and validate this model in independent and unseen cohorts. We were really pleased to see that the score was validated in both a Japanese and Scottish cohort which have very different diets and come from different genetic backgrounds,” explains Caie.
The choice of an automated, intuitive analysis system provided by HALO played an important role in developing this method. “It's the ease of use. It's really simple to get around. You don't need any coding, so you don't need a computer science background or coding background. It was really straightforward to get on from a biologist's perspective,” says Nearchou about her experience using the HALO system.
“They have in-built spatial statistical analysis. So, we wouldn't have to write code or export the data to analyze it,” says Caie. “This spatial information is really useful, especially in immuno-oncology, as people are realizing that the interplay between these different cell types within the tumor microenvironment is more and more important.”
“Also, you can create figures at high resolution within HALO and export them directly into your manuscript, which is actually a really handy tool,” he adds.
Automation brings an unbiased, standardized approach to prognosis. “Counting specific features is very time laborious and time-consuming,” adds Caie. “Observer variability is real when quantifying things like tumor budding or lymphocytic infiltration.”
Using analysis methods removes human subjectivity and saves valuable time. Caie envisions the application of his lab’s prognostic method: “It can free up a pathologist's time and can also triage patients to make sure that the pathologist sees the high-risk patients quicker."