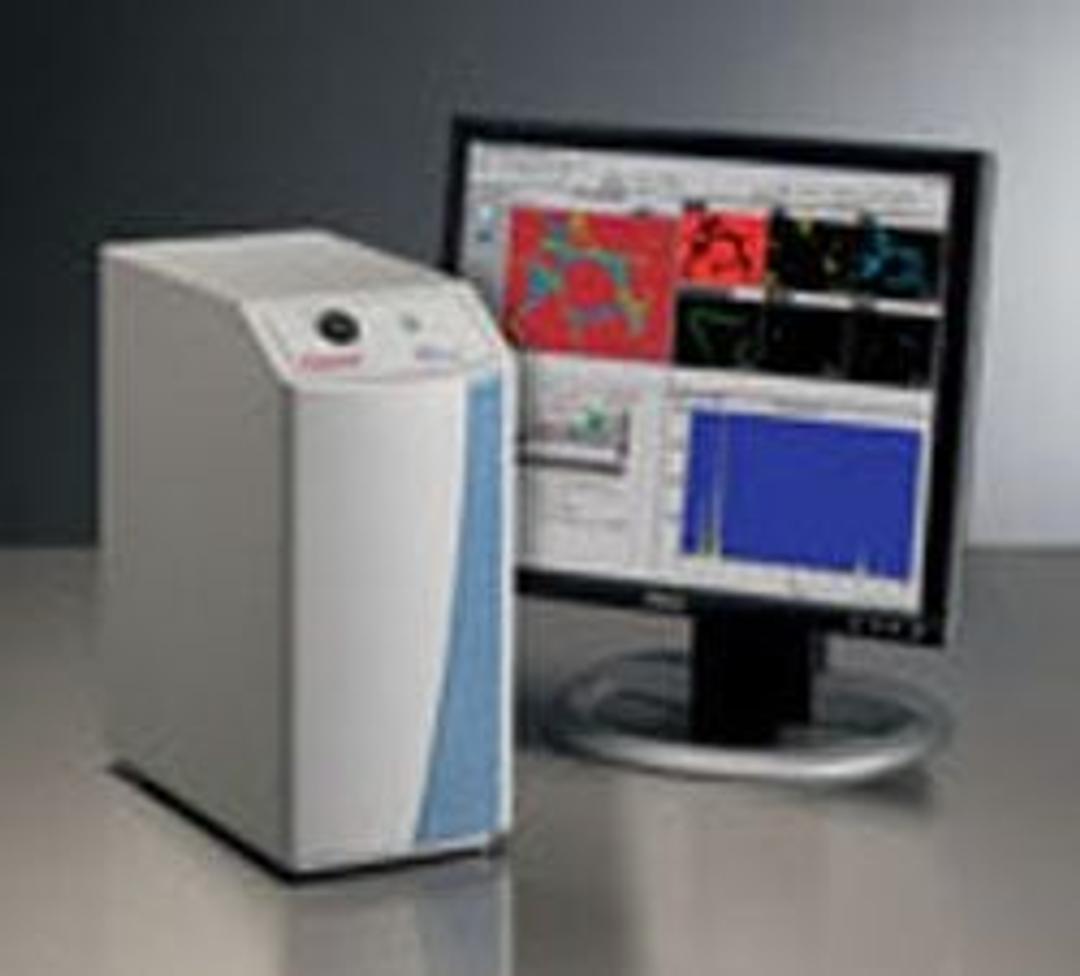
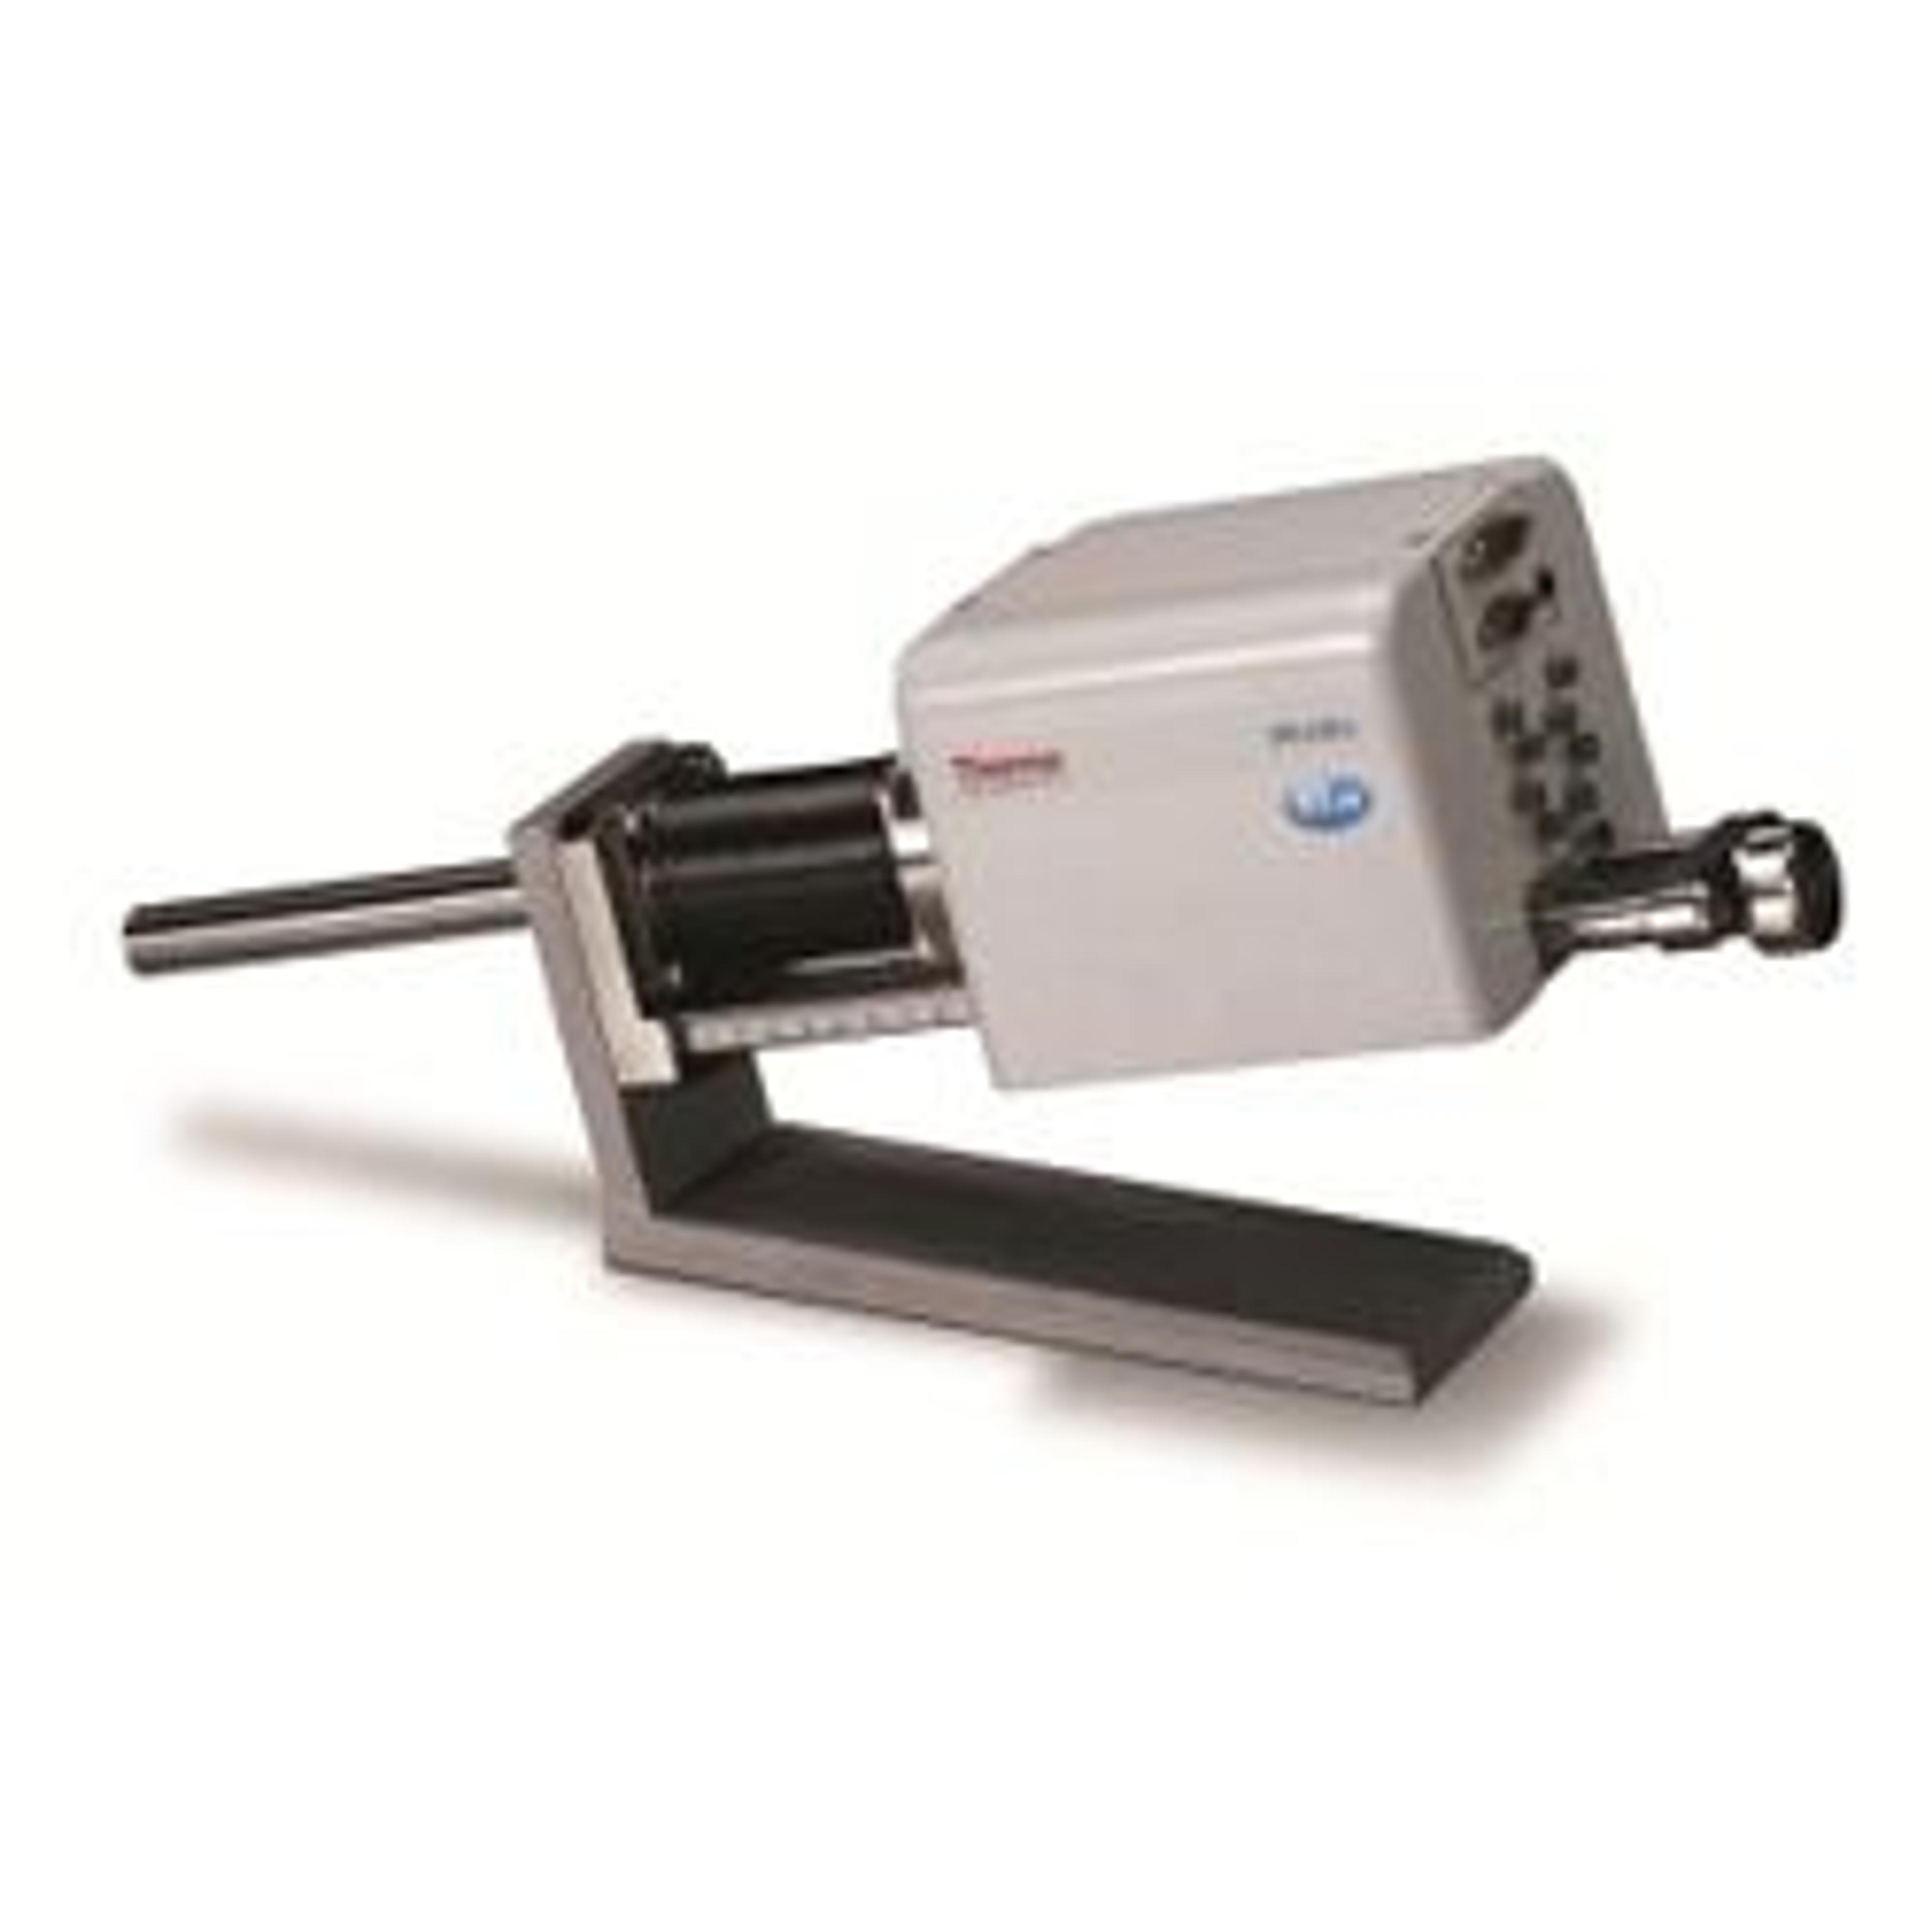
NORAN System 7 X-ray Microanalysis System
Spectral Analysis Identifies elemental peaks quickly and accurately using rule-based identification and peak shape deconvolution SpectraCheck both visually and statistically confirms the presence of an element using spectrum simulation and comparison routines—provides both an overlapped spectrum and a chi-squared value indicating goodness of fit Elemental peak references provide a complete set of spectral peak shapes collected…

The supplier does not provide quotations for this product through SelectScience. You can search for similar products in our Product Directory.
This is a follow-up to a previous review. Now that I've run it for a couple months, I've discovered that it is very unstable. Software crashes daily when saving the Point and Shoot image as a JPG. This is with the PC that they shipped with it. Only lost data twice, so now I save after every step OR ELSE! I also saw that the maps from IXRF go up to 4096 x 4096 pixels: a huge difference from my 256 maps :(
Review Date: 11 Aug 2011 | Thermo Fisher Scientific
Very good EDS with very poor SEM imaging. No high resolution JPG, only low res screen dumps. No annotation on image including no scale bar or magnification. Only able to measure 1 object on the screen at a time and unable to save the information. EDS maps are very low resolution, only 256x204 pixels maximum! (That must be how they do fast maps) That said, the EDS is very accurate. Quant matches very well with ICP and our older Kevex Sigma 32, with or without standards! Overall, the bad imaging brings the system down to unacceptable. I should have got something else.
Review Date: 28 Jun 2011 | Thermo Fisher Scientific
Very easy to use. Elemental mapping is quick and easy. the point and shoot feature saves time. only complaint is that the sn peak is often not differentiated from ca and it must be manually labelled.
Review Date: 13 Jun 2011 | Thermo Fisher Scientific
Spectral Analysis
Identifies elemental peaks quickly and accurately using rule-based identification and peak shape deconvolution
SpectraCheck both visually and statistically confirms the presence of an element using spectrum simulation and comparison routines—provides both an overlapped spectrum and a chi-squared value indicating goodness of fit
Elemental peak references provide a complete set of spectral peak shapes collected with a typical EDS system
The intensities from these shapes are automatically corrected to match the microscope detector—eliminates the need for periodic calibration of the system with standards
Uses the PROZA Phi-Rho-Z matrix correction algorithm
Point and Shoot Mode
Integrates electron imaging and X-ray analysis
Single mouse click provides both elemental identification and quantitative analysis of the selected areas of interest of the sample
Areas on the sample are defined using points, rectangles, circles, polygon or with a magic wand tool
Magic wand tool allows easy, instant outline of complex areas without having to manually draw a border
The selection, based on gray levels, is made automatically with just one click
Selected areas may be analyzed instantly or multiple areas may be selected for automated analysis
Performs processing according to chosen settings
Able to provide the required spectral results—from qualitative analysis to quantitative analysis with full standards
Spectral Imaging
Acquires a spectrum at every point—useful for imaging, X-ray mapping, Linescan and advanced automated analysis
NORAN System 7 collects data that can be analyzed repeatedly without the need for reacquiring or changing acquisition parameters—with one click
Analyze the collected data locally at the microscope or take the data offline to a different computer for report preparation
COMPASS
Allows all of the people in the lab to perform the same analysis and obtain consistent results
Uses powerful multivariate statistical algorithms, as created by Paul Kotula et al. and licensed from Sandia National Labs
Using advanced algorithms, Direct-to-Phase extracts and displays known phases while the data is still being collected
Allow the EDS system to decide when sufficient statistics have been collected, or visualize the data as it develops
Direct-to-Phase
Data analysis concurrent with data collection - the speed of real time phase analysis
Not only presents elemental data in maps and spectra, it develops an information-rich picture of the sample composition—and it produces complete data ten times faster than current X-ray microanalysis technology

