Biomass Deconvolution - Biological Analyses
Biomass Deconvolution is an Xcalibur layered application that enables users to perform commonly used standard tasks in the application of mass spectrometry to samples and analyses that contain biological molecules such as proteins, peptides, and oligonucleotides . The BioBrowser™ window contains commands and features specific for analyzing biological molecules including Biomass Calculation and Biomass Deconvolution.BIOMASS Cal…


The supplier does not provide quotations for this product through SelectScience. You can search for similar products in our Product Directory.
Biomass Deconvolution is an Xcalibur layered application that enables users to perform commonly used standard tasks in the application of mass spectrometry to samples and analyses that contain biological molecules such as proteins, peptides, and oligonucleotides . The BioBrowser™ window contains commands and features specific for analyzing biological molecules including Biomass Calculation and Biomass Deconvolution.
BIOMASS Calculation
BIOMASS Calculation is used in the analysis and interpretation of multiply charged mass spectral data of biopolymers such as peptides and oligonucleotides. The software works well for the analysis of single-component spectra and for spectra with high signal-to-noise ratios. (See BIOMASS Deconvolution below for analysis of mixtures and low signal-to-noise ratios) It can indicate if two or more user-specified mass spectral peaks are related as members of the same charge-state envelope for a given compound. If they are related, it can automatically compute the compound's molecular weight. BIOMASS Calculation can also convolute the mass spectrum of a compound of known molecular weight, to assign a charge state to each peak in the charge-state envelope.
BIOMASS Deconvolution
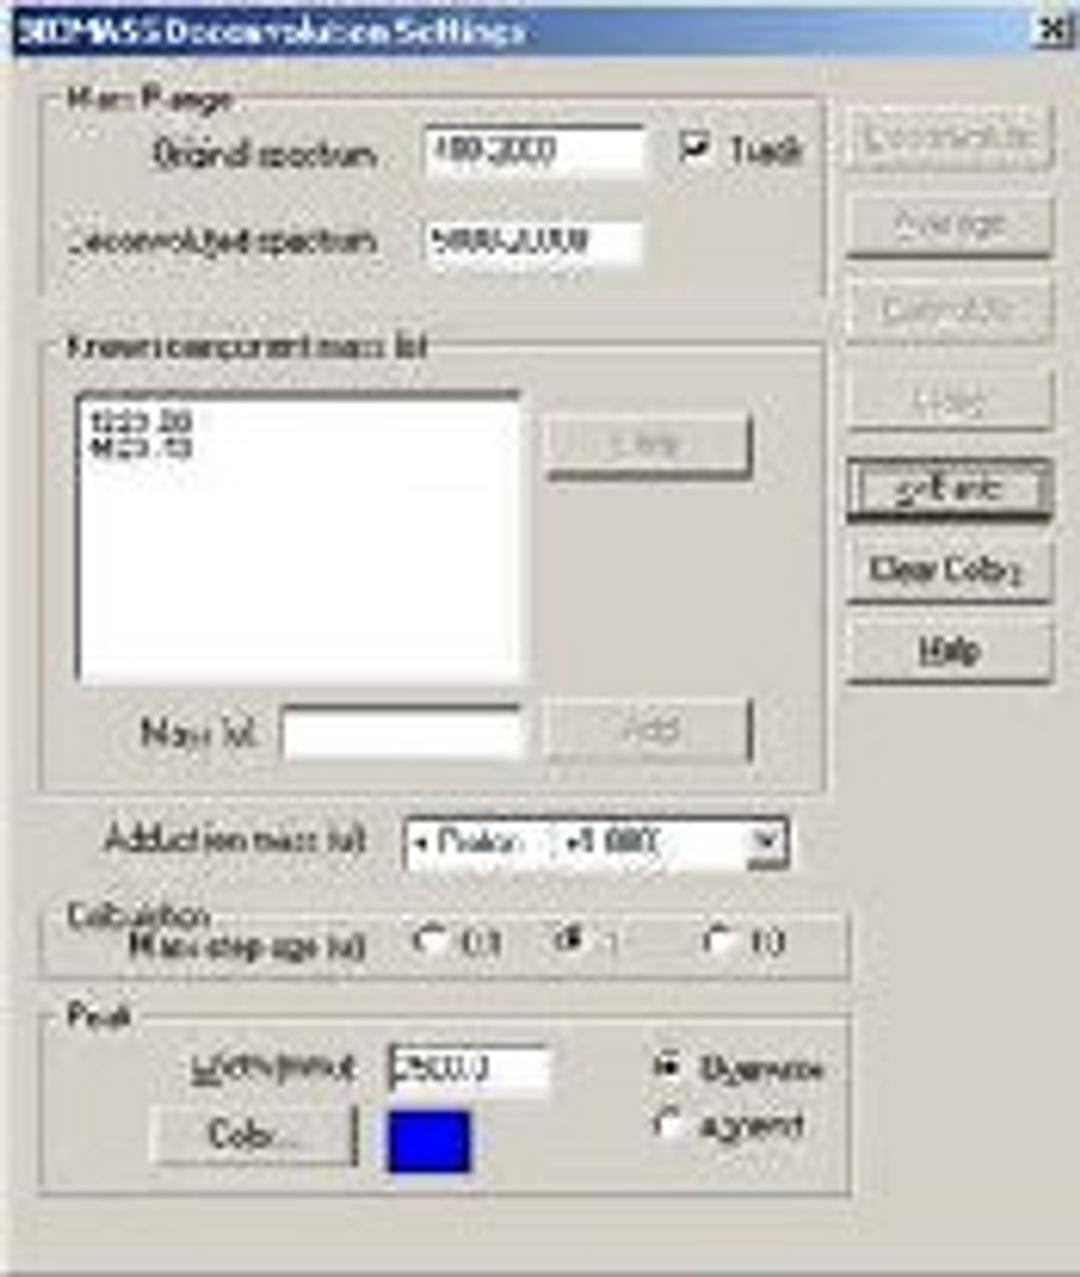
BIOMASS Deconvolution is used in the analysis and interpretation of multiply charged mass spectral data of biopolymers- primarily spectra of mixtures or spectra with low signal-to-noise ratios. The software can determine the average molecular weight of each component in the sample. It can also find the charge state of each peak in the charge-state envelope of a given compound. The deconvolution algorithm transforms an ESI mass spectral plot of relative abundance versus mass-to-charge ratio into a plot of relative abundance versus mass. Each sequence of multiply charged ion peaks in the acquired mass spectrum (corresponding to one sample component) is converted into a single peak.