HALO Link
Get all your collaborators on the same page. Anytime, anywhere access to images & image analysis data from any device
HALO Link
COLLABORATIVE IMAGE MANAGEMENT
HALO Link combines image management with HALO image analysis and takes it to the web to allow secure anywhere, anytime access to study data, slides and analysis results from computer, tablet or smartphone.
With support for almost every digital slide format on the market including multi-channel fluorescence, HALO Link is the perfect solution for multi-user HALO installations, large labs/departments, core facilities, contract research organizations or any other organization that need to securely manage and share slides and analysis data.
MANAGE SLIDES
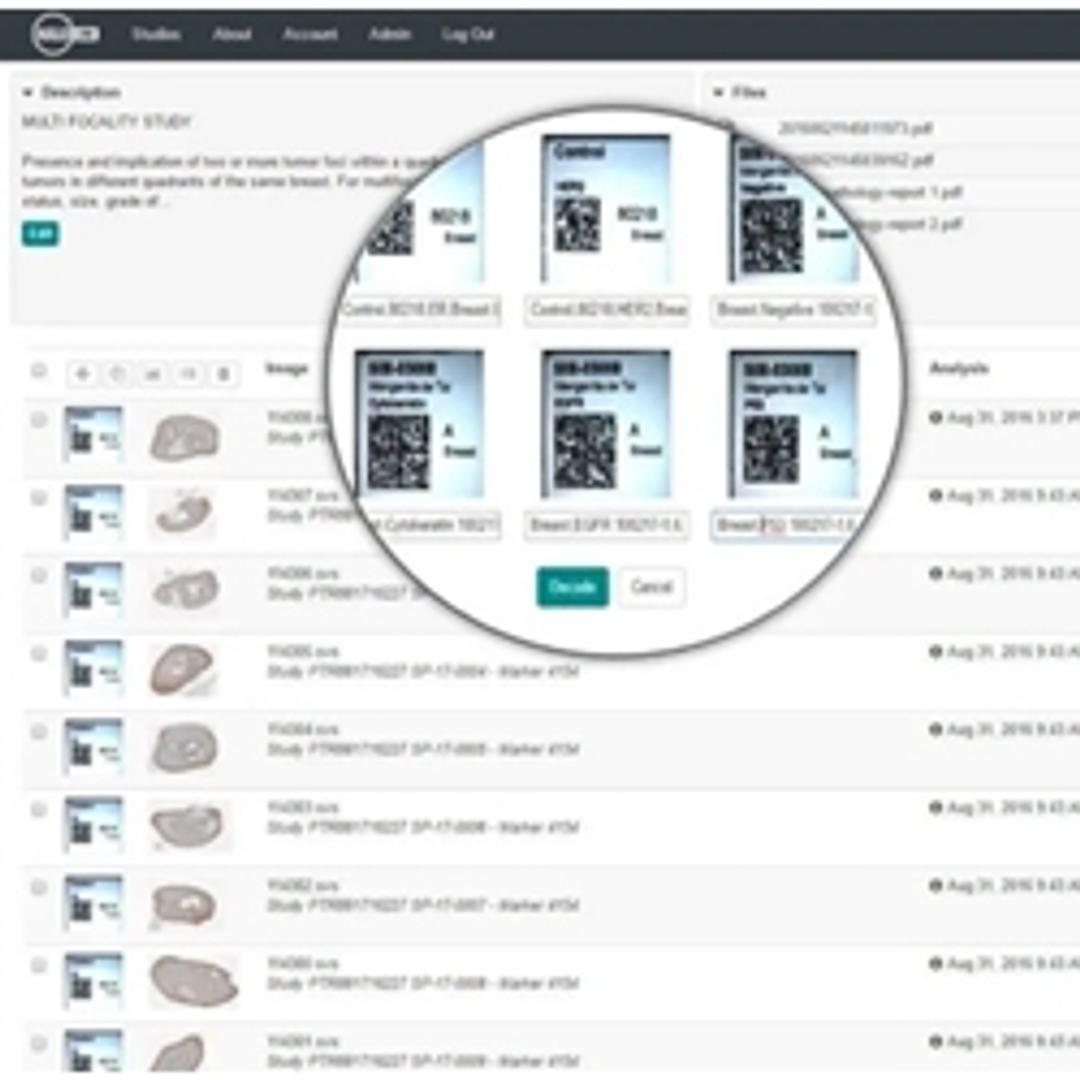
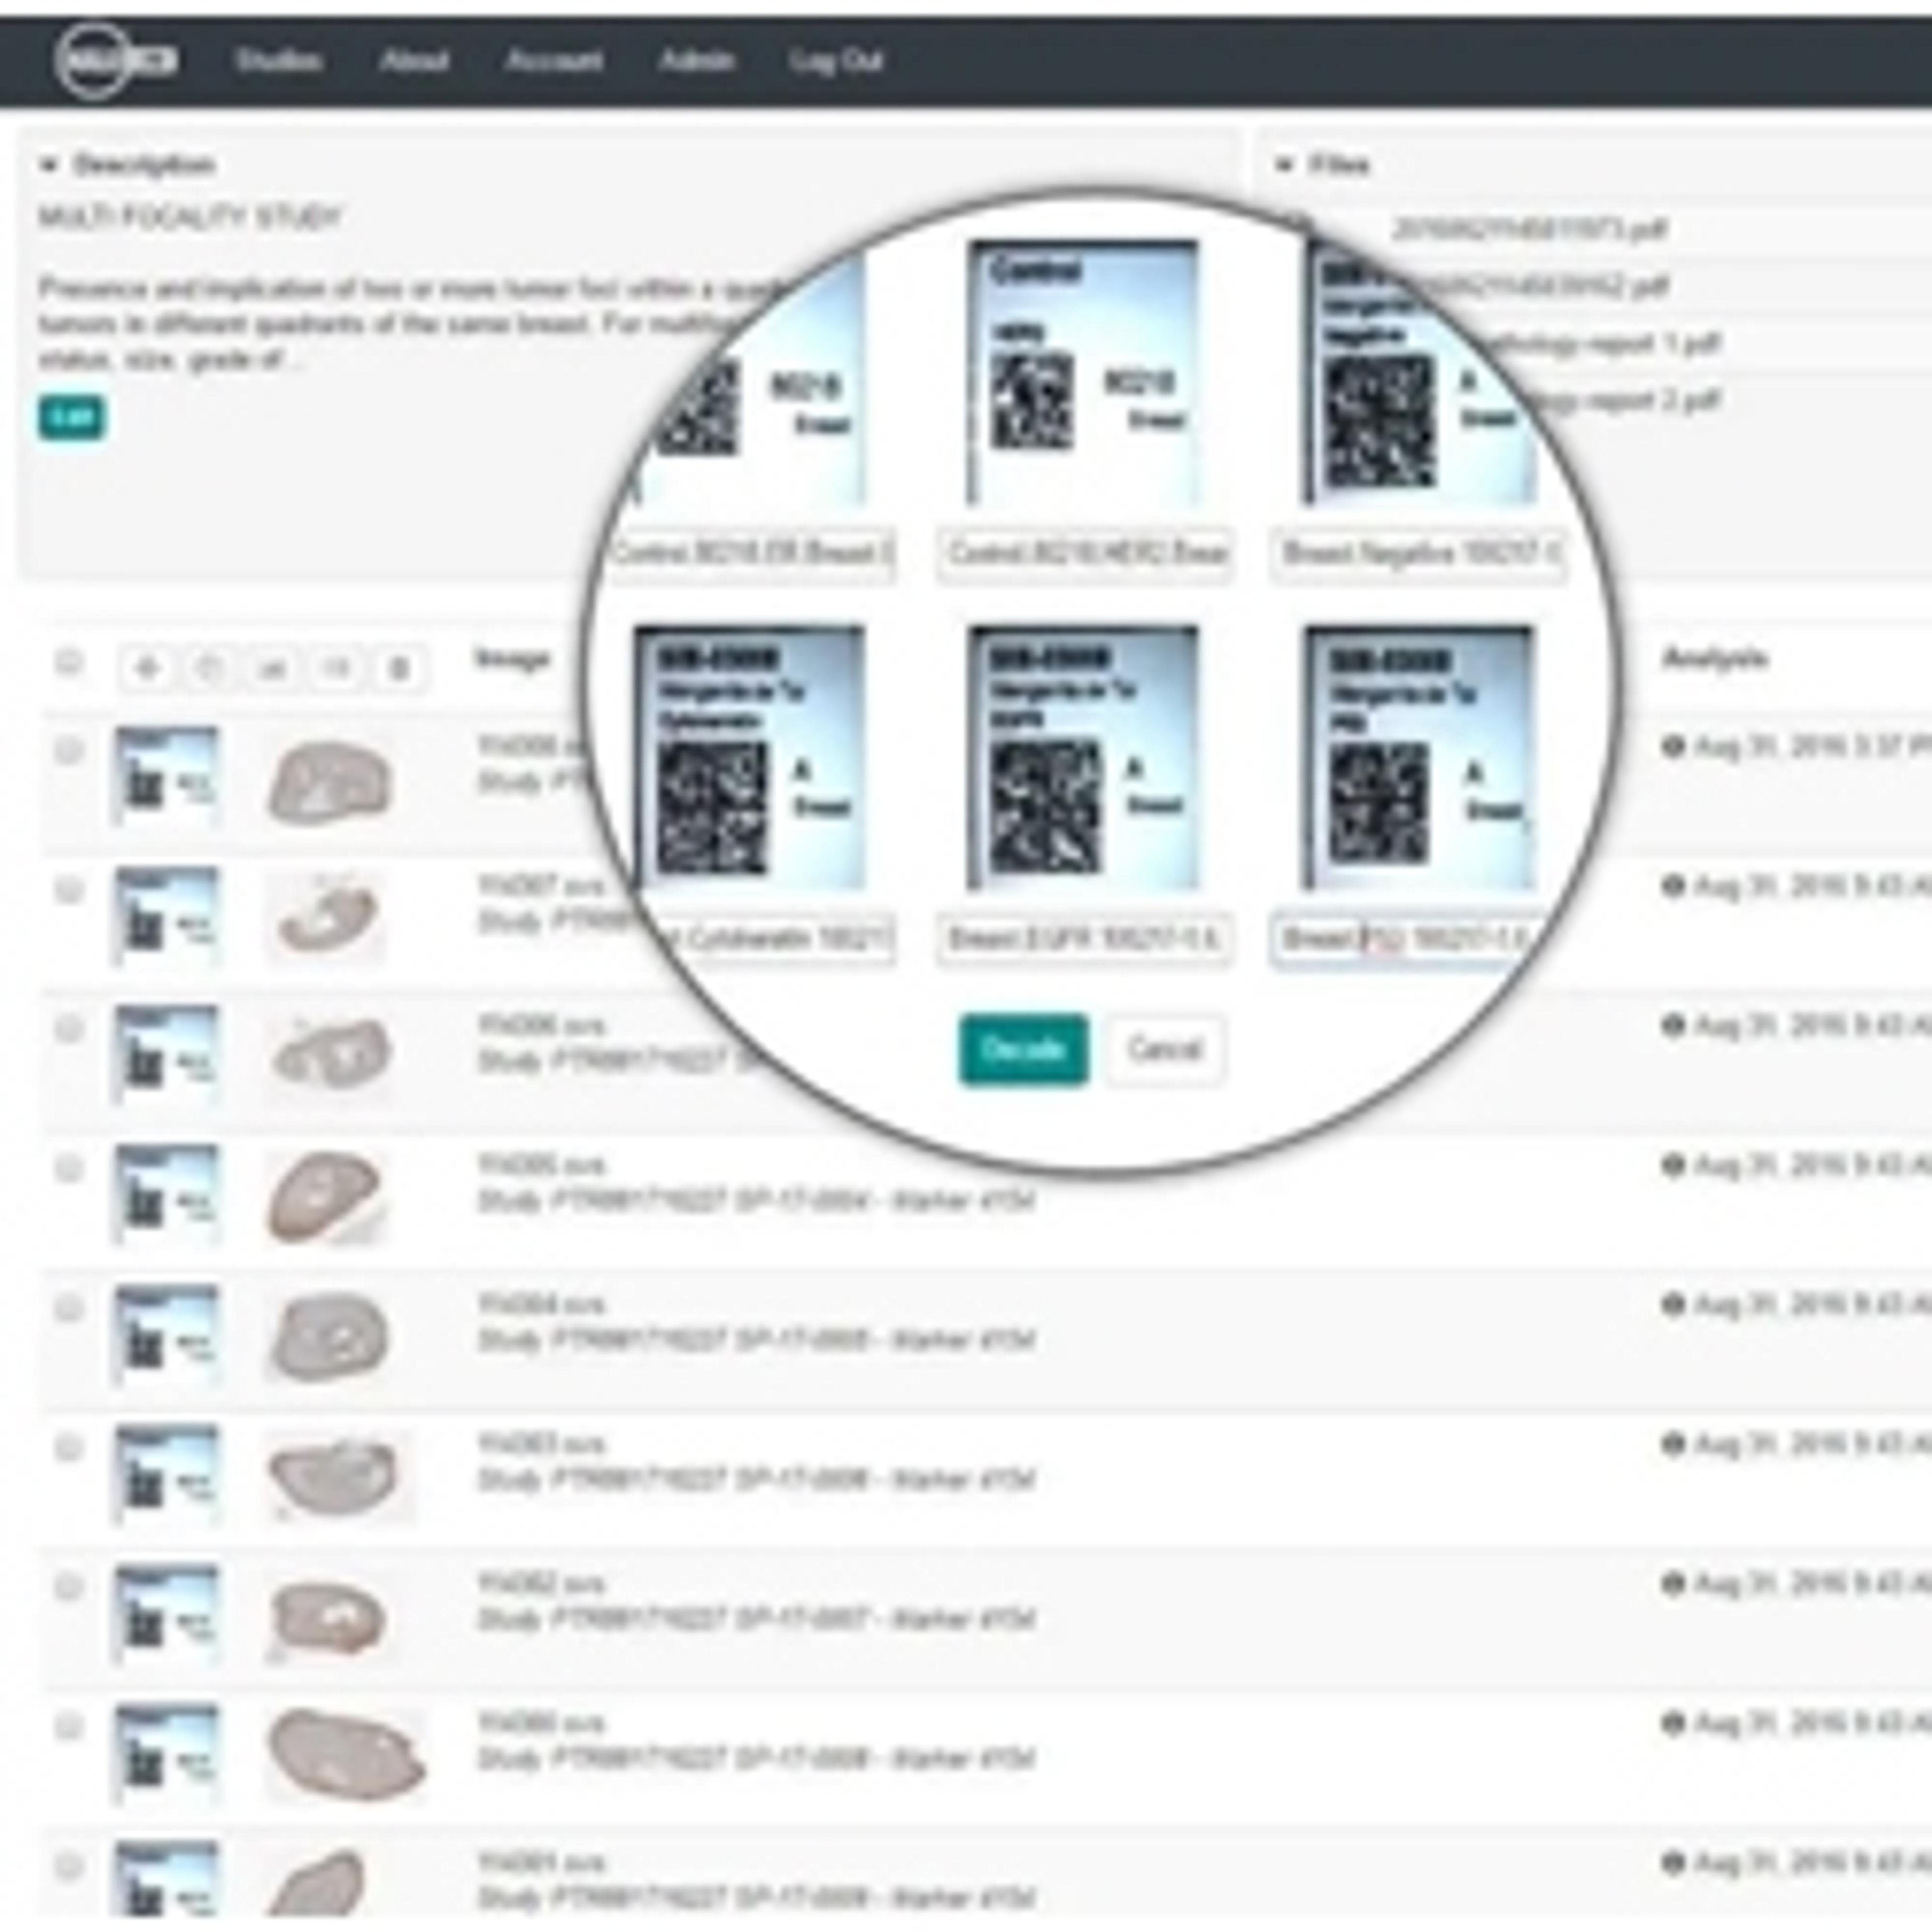
Organize images into studies, add new images automatically using the background File Monitor, or simply drag and drop new images and files into HALO Link. Make data entry easier by pulling information from an LIS system’s 1D barcodes, by parsing information directly from 2D barcodes, or by importing discrete data into matching custom metadata fields. Search, sort, and filter slides from any data, and quickly add selected slides to temporary trays for future examination.
SHARE SECURELY
Assign role-based access permissions to study participants and keep editing privileges in practiced hands. Invite remote collaborators to view or modify patient/specimen data, slide data and attachments, comments, annotations, image analysis mark-ups, and analysis results. Open multiple images into the integrated viewer and start a conference to really focus discussions and annotations of regions of interest.
ANALYZE REMOTELY
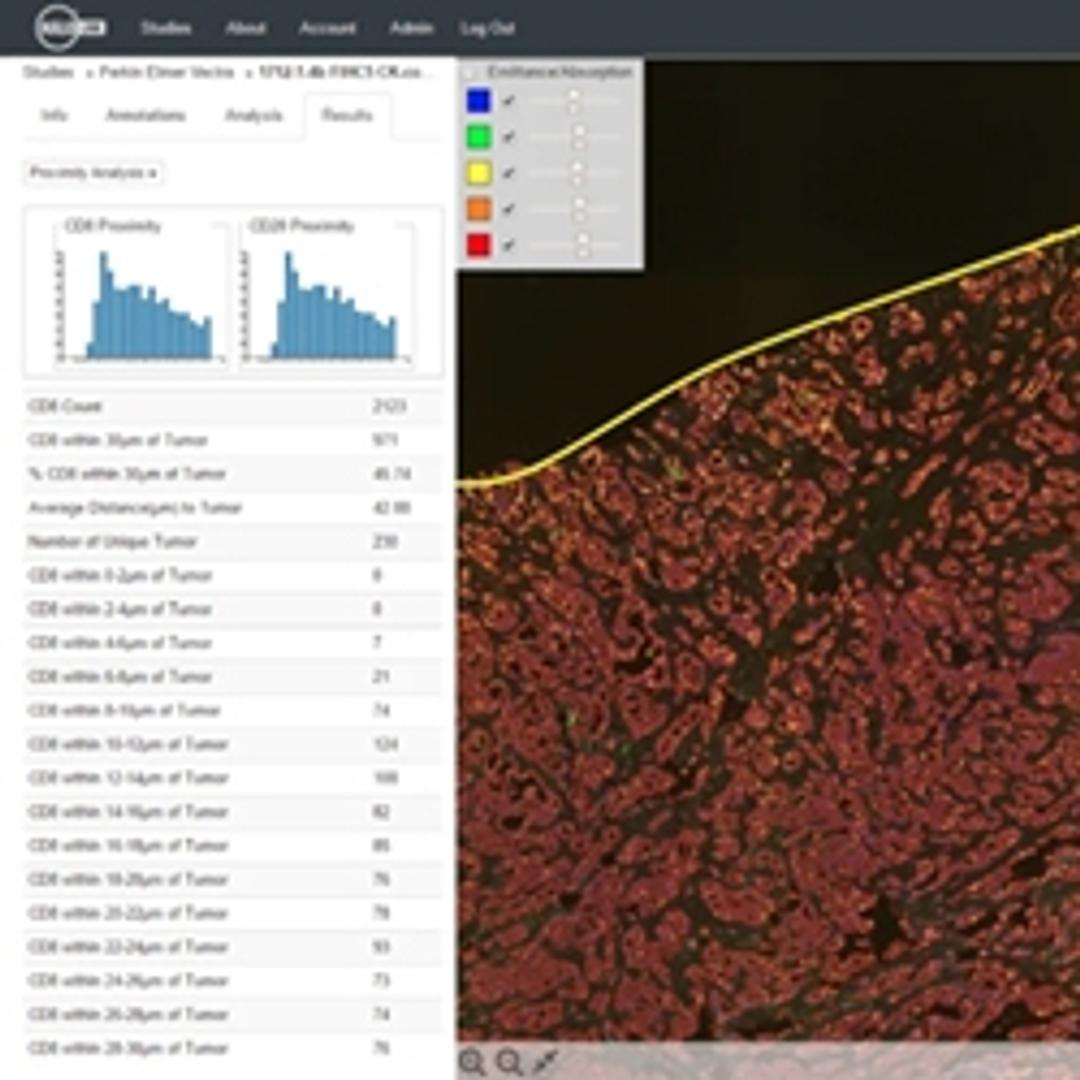
Compatible with most digital slide formats, including brightfield and fluorescence. Images, annotations, markups and analysis are fully connected across applications, and edits from either will be visible in both HALO and HALO Link. Both may also be used to initiate and monitor analysis jobs, to export analysis results, to add and remove HALO AI Classifier training regions, and to operate AI training processes.
VISUALIZE TRENDS
Use any data fields in combination with analysis results to create simple, interactive scatterplots. Each point on the scatterplot is linked back to the original image, allowing users to open and review markup images and analysis results for outliers in a single click. Use these to evaluate trends and to verify the quality of analysis runs.

