NORAN System SIX X-ray Microanalysis System
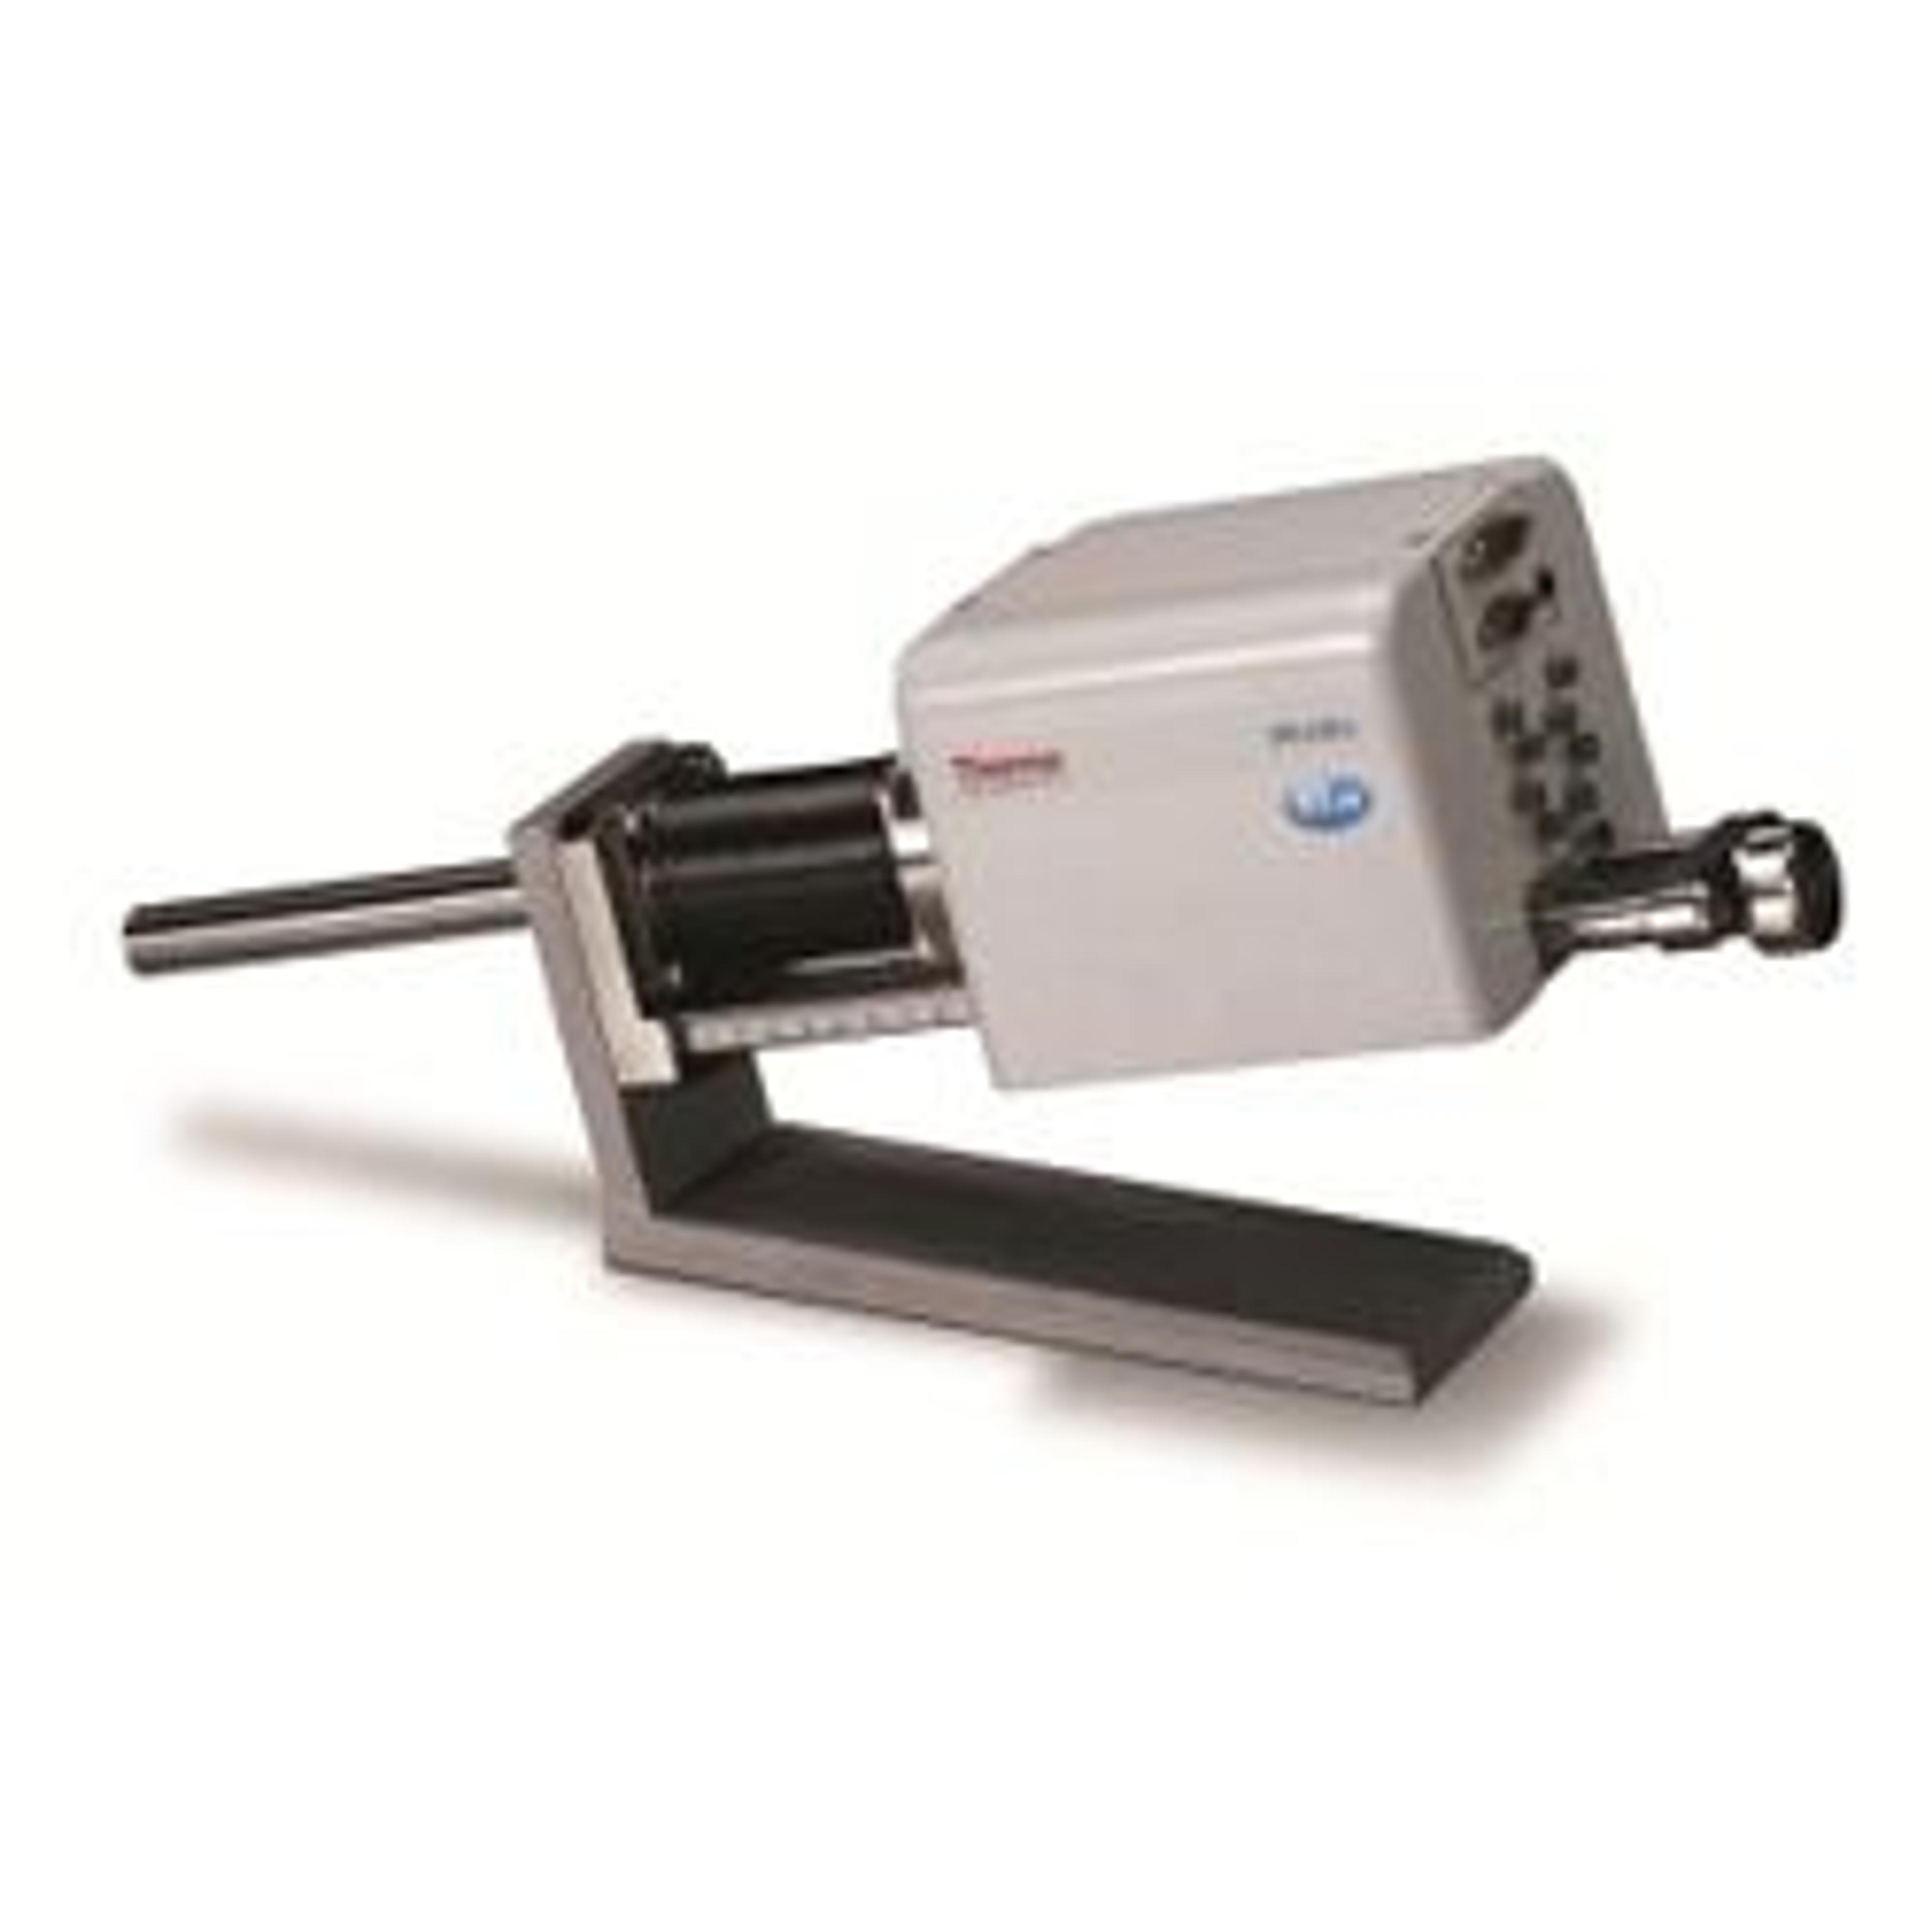
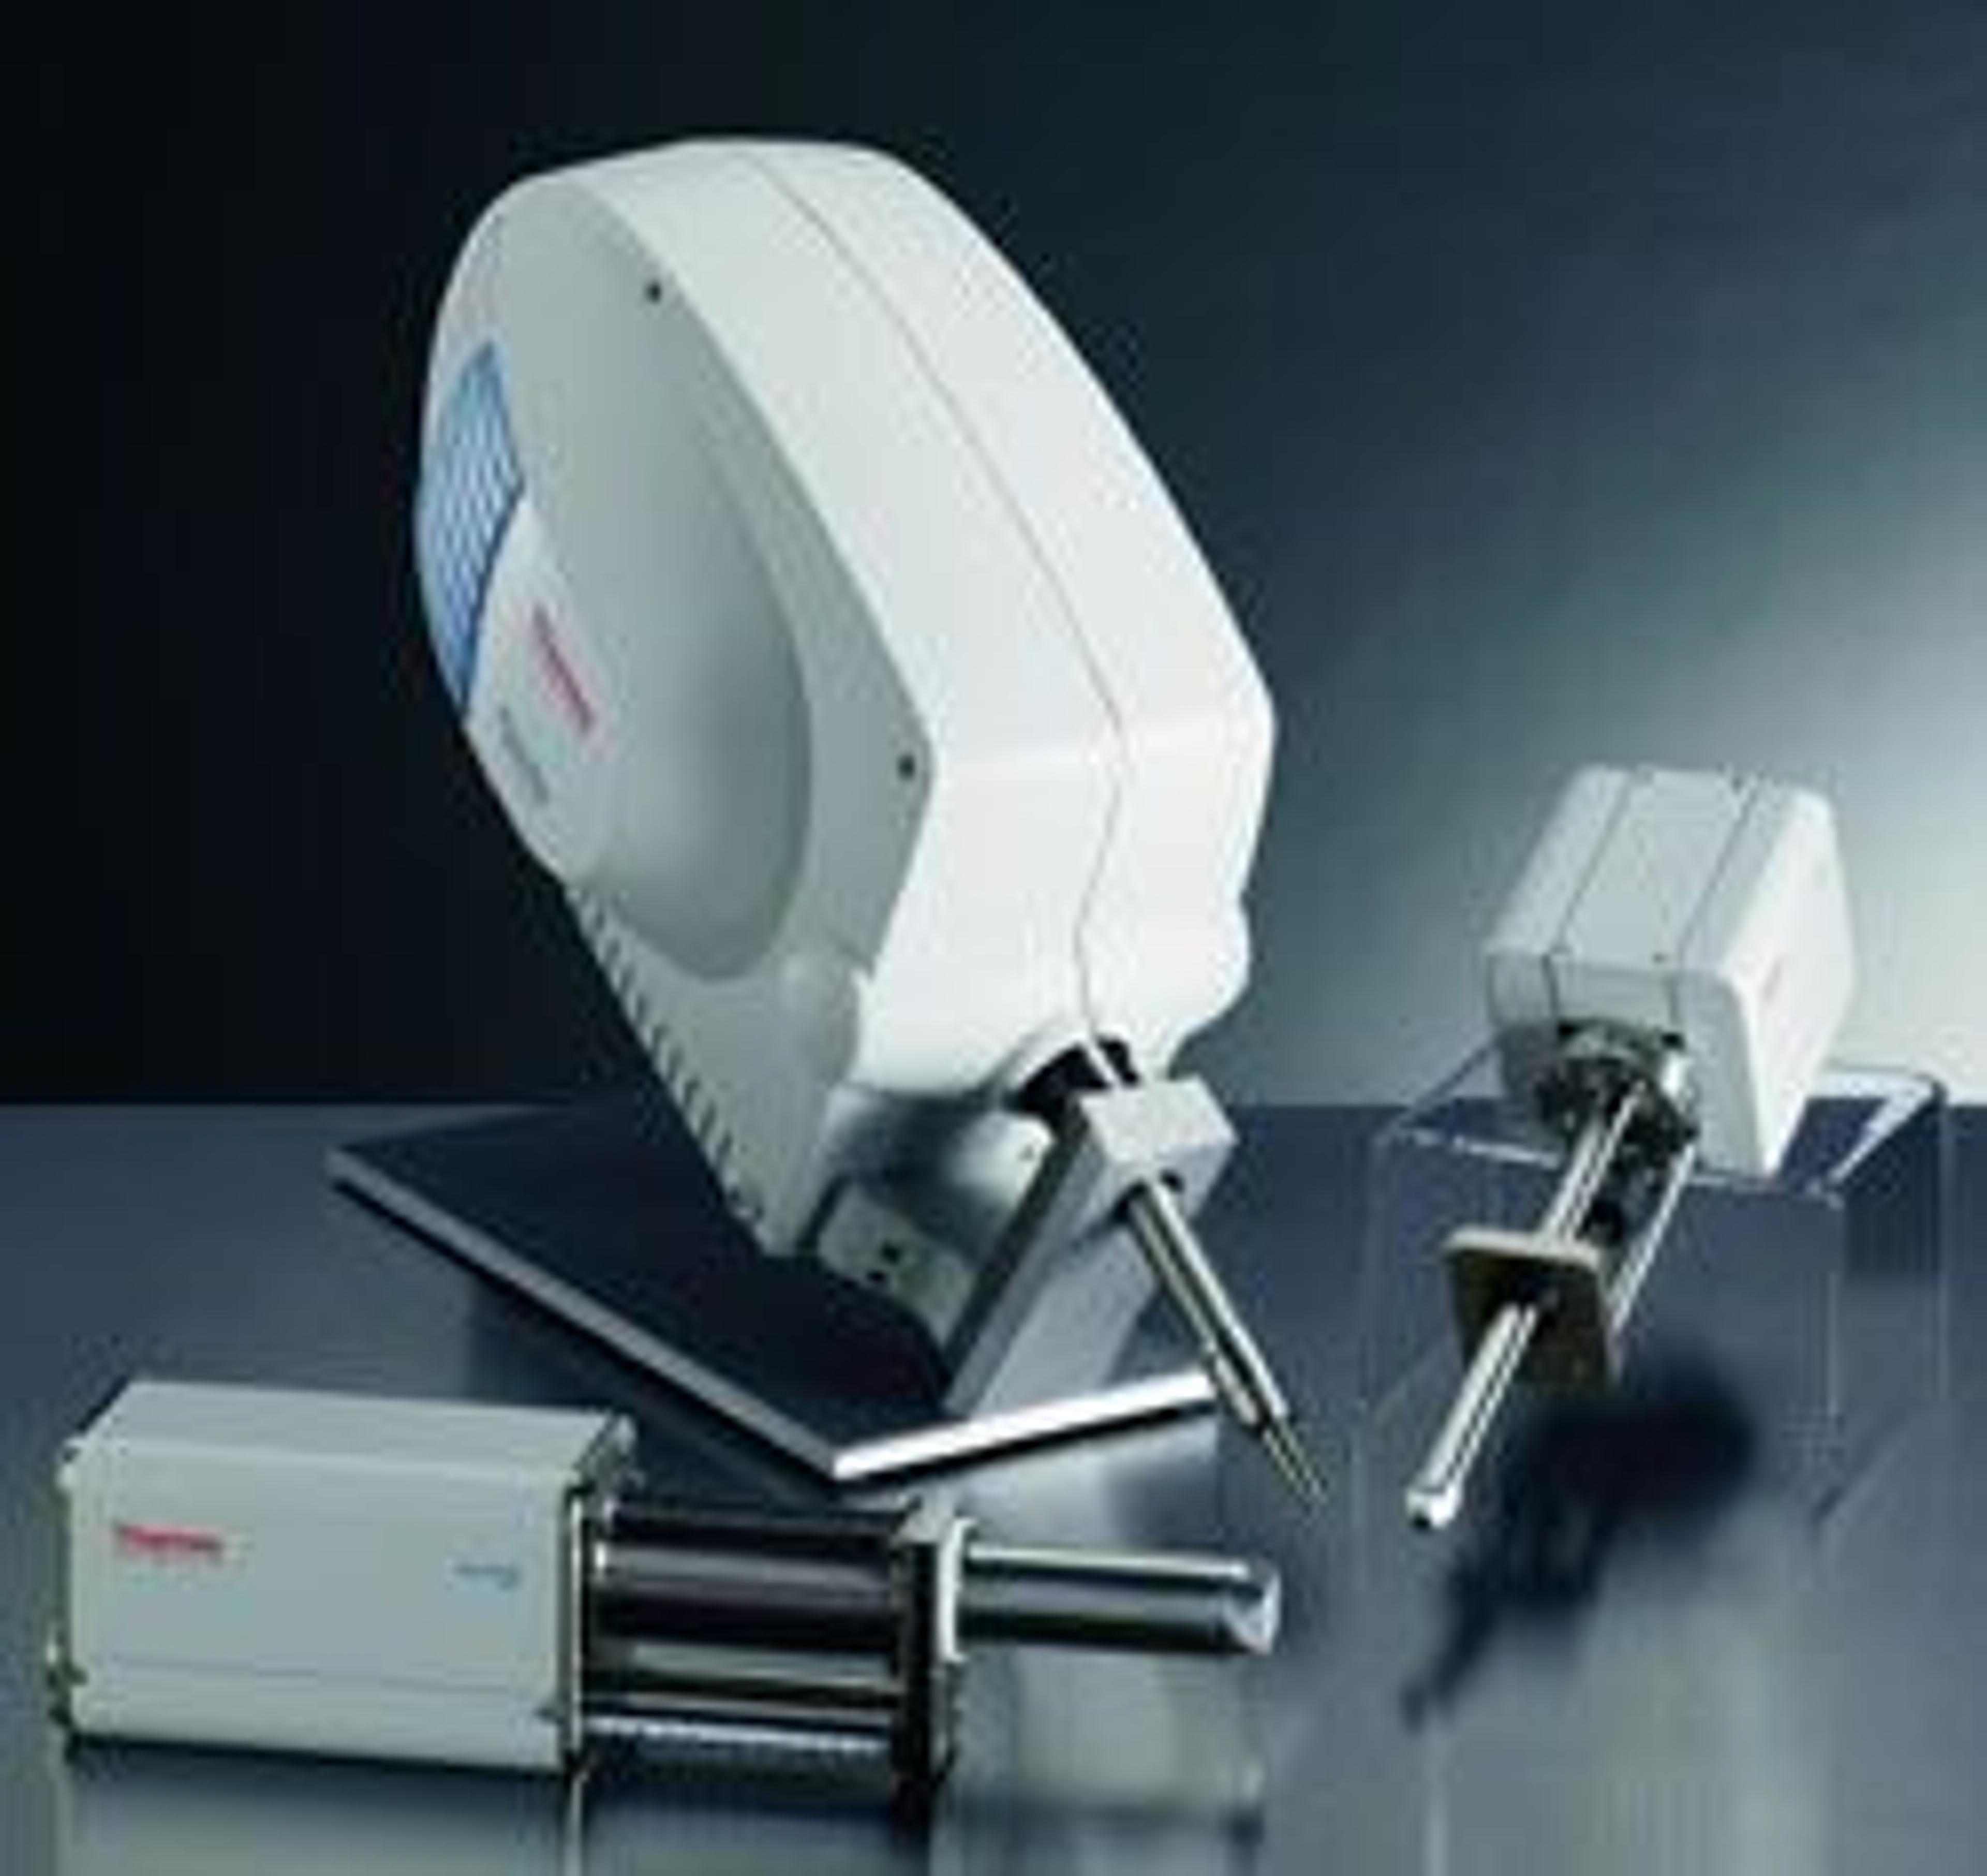
When we developed our next generation X-ray microanalysis system, we made spectral imaging the heart of this analytical tool. Featuring a great combination of electronics designed for high resolution and high throughput, and easy-to-use and power software, the NORAN System SIX is your best choice for intelligent solutions. All your data, all of the time. No oops. No final decisions. It’s okay to change your mind. S…

The supplier does not provide quotations for this product through SelectScience. You can search for similar products in our Product Directory.
When we developed our next generation X-ray microanalysis system, we made spectral imaging the heart of this analytical tool. Featuring a great combination of electronics designed for high resolution and high throughput, and easy-to-use and power software, the NORAN System SIX is your best choice for intelligent solutions.
All your data, all of the time.
No oops. No final decisions. It’s okay to change your mind.
Spectral Imaging acquires a full dataset when you run a sample by collecting a complete, optimized energy spectrum at every point in the sample. Once collected, this dataset can be analyzed as many times as you like using a variety of analysis tools.
Your best tool for compositional mapping.
Spectral Imaging data combines elemental and spatial data to create an ideal representation of your sample. Analyze with familiar microanalysis tools for spectral analysis, x-ray mapping or linescans, or used advanced analysis tools such as COMPASS and XPhase to get deeper into your sample’s data.
The compositional mapping tools on the NORAN System SIX increase in simplicity and decrease the subjectivity of the analysis.
Your best tool for sample surveying.
Seek and you shall be rewarded.
NORAN System SIX includes great tools for exploring the sample. Point-by-point and area-by-area survey tools allow you to quickly locate critical features on the sample for reports and further analysis—just click or drag for instant answers. Linescans get you see changes in the morphology of the sample as you scan across a line. Includes qualitative and quantitative analysis.
Quick and Easy Reports.
Reports make your analyses look good. Easy to use, comprehensive, and customizable. Click, Print. Done.
NORAN System SIX gives you great options for easily creating reports: In one click, your data is automatically placed in a Word or PowerPoint file, ready to be printed or sent to a client. Customizable templates are available, including the ability to put your company’s logo on the report. If you want to extract the data from NORAN System SIX and create the report with your own software (roll your own), all data is available in industry-standard formats such as .tiff and .csv. Reports can be created on a sample-by-sample basis, or as set of samples (project).
Take our data to your office. Store your data in one place.
Don’t tie up the microscope. Get your data, then off-load it.
With the NORAN System SIX, you can freely install all your microanalysis software on an offline computer—whether it be a PC on your organization’s network, or your personal laptop computer. Use you microscope for collecting data. Use another computer for all of your analytical work. Because NORAN System SIX files are network and project manager friendly, you can easily share your results with colleagues.
Features
- Drift Compensation option for long or high magnification acquisitions (read more)
- Analysis Automation option, providing an easy way to collect data from multiple stage locations (read more)
- Feature sizing with chemical typing option (read more)
- Quantitative mapping and linescans (read more)
- Spectral simulation for verification of peak identification(read more)
- One user interface/window for all application modes
- Project Explorer for easy project and data management
- Digital pulse processor and digital beam control electronics
- Higher throughput acquisitions, greater microscope control, accurate results
- Automatic “best choice” settings for acquisitions and analyses
- Peaks automatically identified during acquisitions and on-the-fly during analyses
- One-click Microsoft Word and PowerPoint reports
- Data is stored in industry standard formats
Traditional X-ray Microanalysis
- Qualitative X-ray mapping and linescans
- Automatic quantitative analysis
- Exclusive PROZA matrix correction routine (read more)
- Electron image acquisition
- RGB image color overlays
- Automated Point-and-Shoot mode
Spectral Imaging
- Collect a data set (up to 1024 x 1024 pixels) of full, deadtime-corrected spectrum at every point in a scanned electron image
- Complete, archival record of the sample
- Extract spectra, x-ray maps and linescans from the data set at any time
- Standard microanalysis tools—spectral analysis, image and x-ray maps, linescans, qualitative and quantitative analysis
- Accurate automatic peak identification
COMPASS Automated Statistical Analysis
- Quickly generating “pure” component maps with single-pixel intensity
- Completely eliminates time-consuming point-by-point analyses
- Removes sample assumptions from the analysis (no ROIs and x-ray maps)
- Even a single distinct pixel in the data set is detectable
- Unparalleled solution for needle-in-a-haystack problems
- 2001 Macres Award winner and a 2002 R&D 100 winner
- Exclusively licensed to Thermo Electron by Sandia National Laboratories
XPhase Distribution Software
- Provides a complete understanding of the phase distribution in a sample
- Provides true chemical localization from Spectral Imaging data
- Provides phase maps and extracted phase spectra
- Operates on grayscale and binary images
- No operator input required (manual mode available for power-users)
- Analyzes x-ray maps or COMPASS component maps
Spectral Match
- Chemically identifies spectra
- Automatically run complete spectral analysis following the acquisition
- Matches an unknown using spectral database
- Search by selected energy range or complete energy range
- Several spectral databases available
- User-created databases

